
STATISTICS & HYPOTHESIS TESTING
A/B Testing Analysis: Evaluating New Landing Page Conversion Performance

Overview
This project analyzes an A/B testing experiment to evaluate whether a new landing page improves conversion performance compared with the existing landing page.
The analysis follows a structured statistics workflow, including data cleaning, exploratory analysis, and hypothesis testing using a two-proportion z-test.
The goal is to determine whether the difference between the control and treatment groups is statistically significant and provide a clear business recommendation based on the results.
This project demonstrates practical use of statistical testing in digital marketing and conversion optimization, with a focus on turning experiment data into actionable decisions.
Objectives
- Evaluate whether the new landing page improves user conversion
- Compare conversion rates between control and treatment groups
- Perform statistical hypothesis testing using a two-proportion z-test
- Interpret the results using p-value and significance level
- Provide a business recommendation based on the experiment outcome
Tech Stack







Dataset
The project uses two datasets:
ab_data.csv
Contains A/B testing experiment results.
Main columns:
user_id— Unique identifier for each visitortimestamp— User visit timegroup— Control or treatment assignmentlanding_page— Old page or new page shown to the userconverted— Final conversion result (0 = no, 1 = yes)
countries.csv
Contains user location data linked by user ID.
Main columns:
user_id— Unique user identifiercountry— User location
Workflow
- Imported
ab_data.csvandcountries.csvinto pandas DataFrames - Reviewed dataset dimensions and column structure
- Inspected the first few rows of each dataset
- Verified that the required fields were available for analysis
Goal: Ensure both datasets are loaded correctly and ready for cleaning.
- Checked for missing values in both datasets
- Identified duplicate user IDs
- Validated control and treatment assignments
- Removed duplicate and invalid records
- Prepared the final cleaned dataset for analysis
Goal: Create a reliable and consistent dataset before statistical testing.
- Calculated the overall conversion rate
- Compared conversion performance between groups
- Reviewed landing page distribution
- Merged country data using
user_id - Analyzed user distribution by country
Goal: Understand user behavior patterns and identify early insights before testing.
- Defined the null and alternative hypotheses
- Set the significance level at α = 0.05
- Calculated conversions and observations for each group
- Performed a two-proportion z-test
- Evaluated z-statistic and p-value
Goal: Determine whether the conversion rate difference is statistically significant.
- Reviewed statistical output
- Compared p-value against the significance level
- Interpreted the final hypothesis test result
- Evaluated whether the difference was meaningful
Goal: Turn statistical output into clear analytical findings.
Exploratory Data Analysis
Overall Conversion Rate
- Calculated the total conversion rate across all valid observations
- Measured the percentage of users who completed the target action
- Reviewed the baseline conversion performance of the experiment
Result:
Overall conversion rate = 11.95%
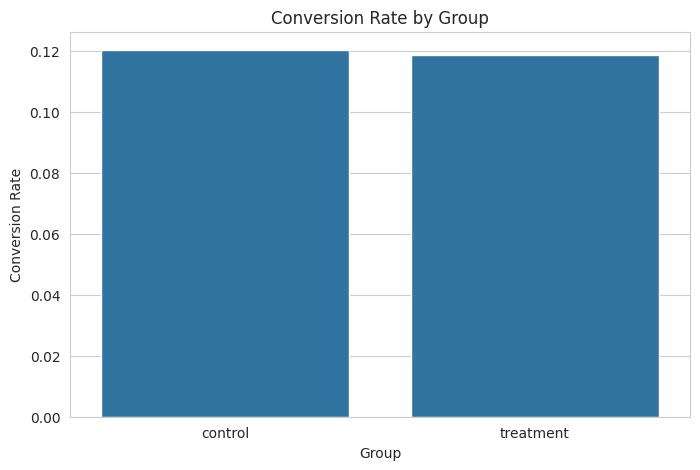
Conversion Rate by Group
- Calculated conversion performance for control and treatment groups
- Compared the percentage difference between both landing pages
- Reviewed whether either group showed stronger early performance
Results:
- Control Group = 12.03%
- Treatment Group = 11.87%
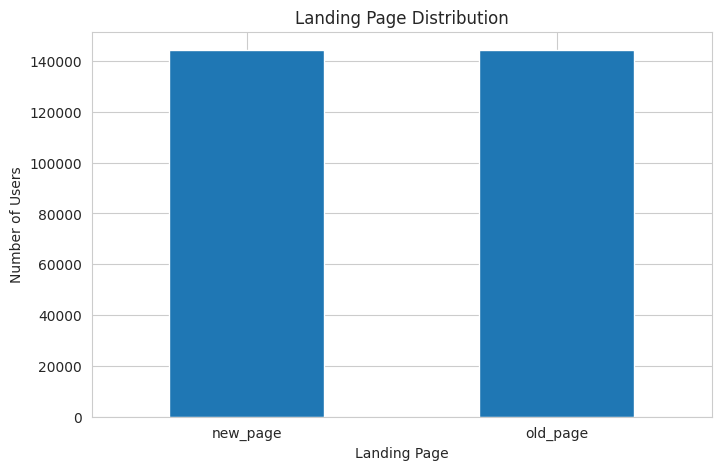
Landing Page Distribution
- Counted users assigned to each landing page
- Reviewed experiment balance between control and treatment
- Verified that both groups had similar distribution
Results:
- Old Page = 144,226 users
- New Page = 144,315 users
The distribution was balanced across both groups.
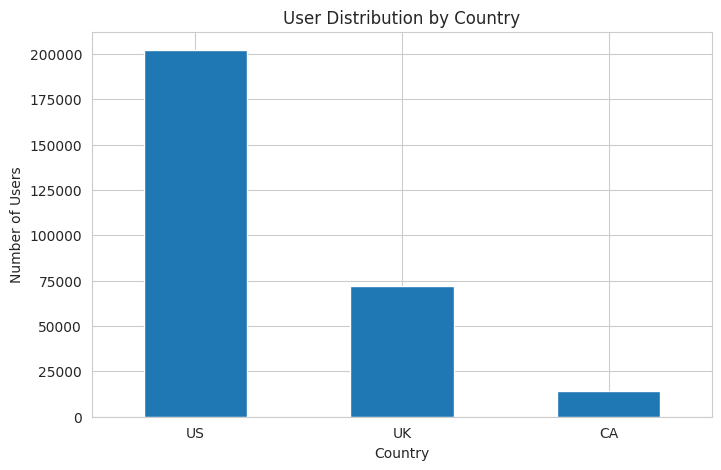
Country Distribution
- Merged
countries.csvwith the A/B testing dataset - Counted users by country
- Reviewed location-based distribution
Results:
- United States = 202,187 users
- United Kingdom = 71,961 users
- Canada = 14,394 users
Most experiment traffic came from the United States.
Statistical Hypothesis Testing
After reviewing the dataset through exploratory analysis, the next step was testing whether the observed conversion difference between both groups was statistically significant.
The purpose of this stage was to determine whether the performance difference between the old landing page and the new landing page was meaningful or simply caused by random variation.
A two-proportion z-test was selected because the experiment compares conversion rates between two independent groups and the outcome is binary.
Define the Hypothesis
The analysis started by defining the statistical hypotheses.
Null Hypothesis (H₀)
There is no significant difference in conversion rate between the control group and the treatment group.
Alternative Hypothesis (H₁)
There is a significant difference in conversion rate between both groups.
Significance Level
α = 0.05
Decision rule:
- If p-value < 0.05 → reject the null hypothesis
- If p-value ≥ 0.05 → fail to reject the null hypothesis
Prepare Group Data
Before running the test, conversions and total users were calculated for each group.
Control Group
- Users: 144,226
- Conversions: 17,356
Treatment Group
- Users: 144,315
- Conversions: 17,132
This data became the input for the statistical test.
Run Two-Proportion Z-Test
A two-proportion z-test was used to compare conversion performance between both groups.
The test measured whether the difference between conversion rates was statistically significant.
Results:
- Z-statistic = 1.2949
- P-value = 0.1953
Evaluate the Result
The p-value was compared against the significance level.
Result:
0.1953 > 0.05
Because the p-value is greater than α = 0.05:
- The null hypothesis could not be rejected
- The difference between both groups was not statistically significant
Interpretation
The two-proportion z-test produced a p-value of 0.1953, which is higher than the significance level of 0.05. This means the null hypothesis could not be rejected, and there is not enough statistical evidence to conclude that the redesigned landing page performs differently from the original page. Although the control group showed a slightly higher conversion rate (12.03%) than the treatment group (11.87%), the difference was not statistically significant.
From a business perspective, the redesigned landing page did not generate measurable improvement during the experiment. Since the results were based on a large and balanced dataset, the difference is likely caused by normal variation. Based on this analysis, the current landing page should remain active while future optimization opportunities continue to be tested.
Key Insights
- Overall conversion performance remained stable at 11.95%
- The control group recorded a slightly higher conversion rate (12.03%) than the treatment group (11.87%)
- Landing page distribution was balanced across both experiment groups
- Most users in the experiment came from the United States
- The difference between both landing pages was relatively small
- The two-proportion z-test showed no statistically significant difference (p-value = 0.1953)
- The redesigned landing page did not produce measurable conversion improvement
- Statistical testing helped prevent rolling out a change without clear performance impact
Recommendations
- Continue using the current landing page
- Do not roll out the redesigned page yet
- Test new landing page variations before making another rollout decision
- Analyze conversion performance by country
- Segment users by traffic source for deeper analysis
- Continue monitoring conversion trends over time
- Use future A/B tests to identify more effective design changes
Future Improvements
- Build an automated A/B testing dashboard
- Track conversion performance over a longer testing period
- Analyze user behavior by country and segment
- Compare multiple landing page variations at once
- Evaluate additional design elements such as headlines and call-to-action buttons
- Integrate A/B testing performance into marketing reporting dashboards
- Monitor experiments in real time for faster decision making