
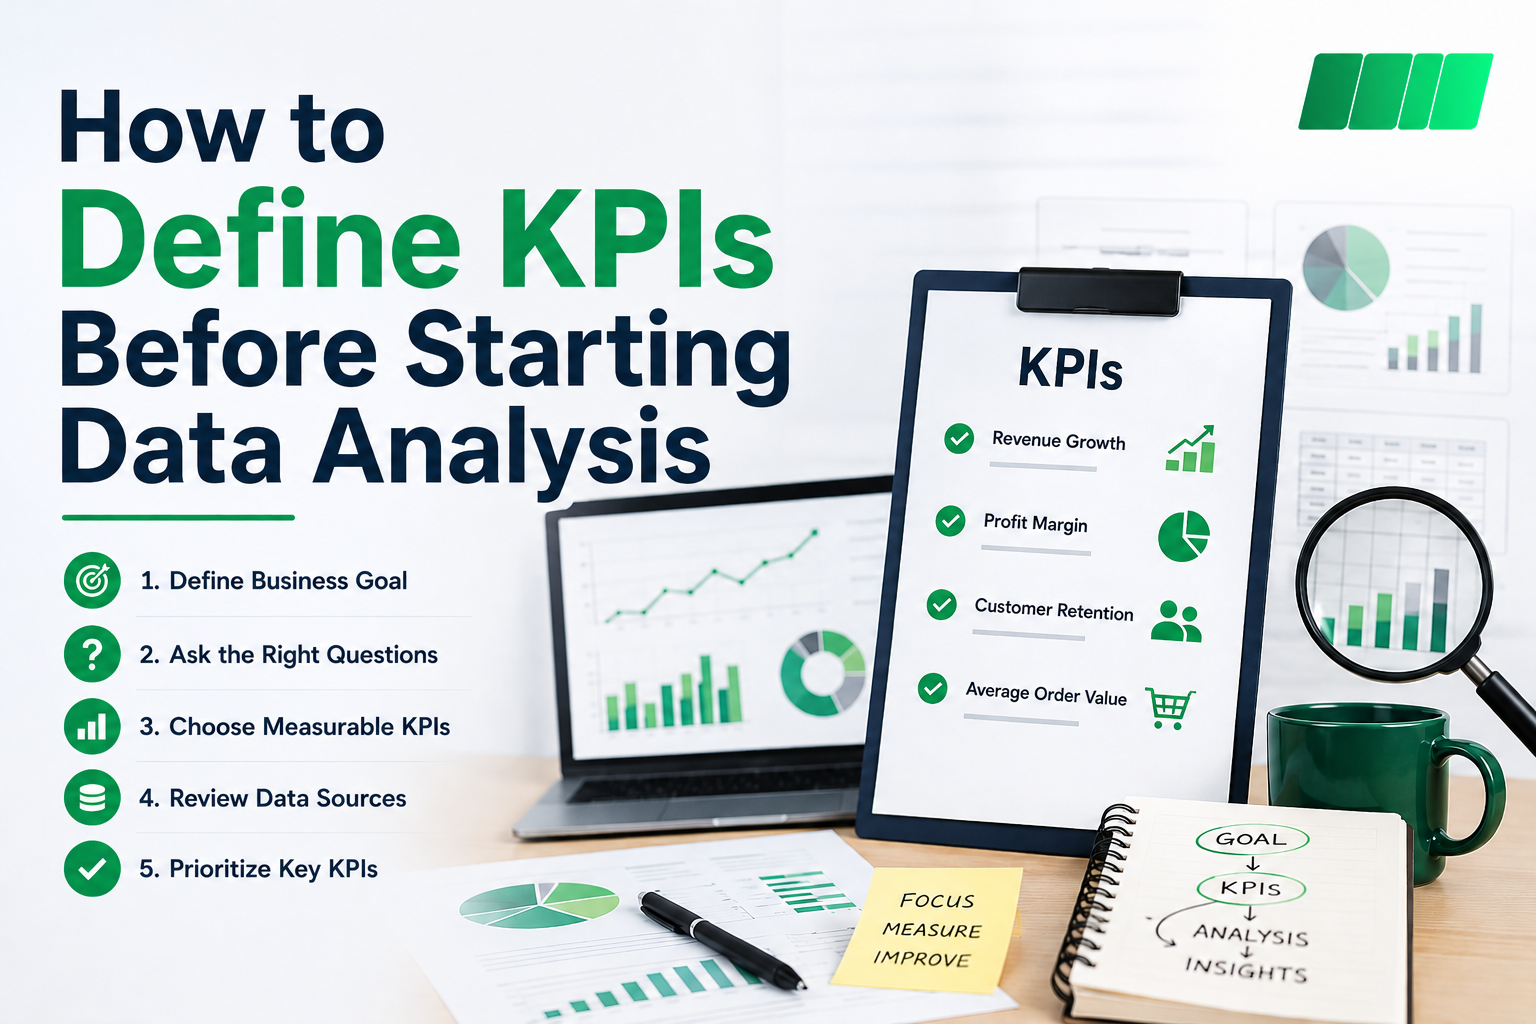
Data analysis can be one of the most powerful tools for understanding what is happening inside a business. It helps teams identify trends, uncover patterns, and make better decisions based on facts rather than assumptions. However, before opening a spreadsheet, writing SQL queries, or building a dashboard, there is one important step that should always come first: defining KPIs.
Many data analysis projects become more complicated than they need to be because the objective was never clearly established from the beginning. It is easy to spend hours cleaning data, creating visualizations, and searching for insights, only to realize that the analysis does not actually answer the most important business questions. This usually happens when there is no clear KPI guiding the process.
Key Performance Indicators, or KPIs, provide structure and direction. They help turn a broad business objective into measurable goals that can be tracked and analyzed over time. More importantly, they make sure that the analysis stays focused on outcomes that actually matter.
In this article, we will look at how to define KPIs before starting data analysis, why this step matters so much, and how businesses use KPI-driven analysis to turn raw numbers into practical decisions.
Why KPIs Should Be Defined Before Data Analysis
When people begin analyzing data without a clear KPI, the process often feels busy but unproductive. There may be plenty of charts and numbers, but not enough clarity about what those numbers actually mean.
Defining KPIs before the analysis begins helps solve that problem because it creates a clear connection between the business objective and the data being analyzed. Instead of exploring every available metric, you are working with a clear purpose from the start.
This matters for several reasons:
- It keeps the analysis aligned with business goals.
- It helps identify which data is relevant and which is not.
- It reduces time spent on unnecessary reporting.
- It makes dashboards more focused and easier to understand.
- It allows performance to be measured consistently over time.
- It makes recommendations more actionable for decision-makers.
A useful way to think about it is this: data analysis tells you what is happening, but KPIs tell you what deserves your attention.
Without KPIs, you may find interesting patterns. With KPIs, you can find patterns that actually support decisions.
Start with a Clear Business Goal
The first step in defining KPIs is understanding exactly what the business wants to achieve.
This sounds simple, but it is often where teams become too broad. Goals like “improve performance” or “grow the business” sound useful, but they are difficult to measure because they are too general.
A stronger goal is specific and tied to a real business outcome.
For example:
- Increase online sales over the next quarter
- Reduce employee turnover this year
- Improve shipping efficiency for customer orders
- Increase customer retention rate
- Improve profitability for a product category
Once the goal is clearly defined, choosing KPIs becomes much easier because the measurement naturally follows the objective.
For example, if the goal is to improve sales, useful KPIs could include:
- Monthly revenue
- Conversion rate
- Average order value
- Revenue by product category
If the goal is to improve employee retention, the KPI list will look very different:
- Employee turnover rate
- Average tenure
- Resignation count by month
- Retention after one year
The clearer the goal, the easier it becomes to define KPIs that truly support the analysis.
Turn the Goal into Questions the Data Can Answer
Once the business objective is clear, the next step is translating that goal into practical questions.
This is where the analysis starts becoming more strategic.
For example, imagine a retail company wants to improve profitability. That goal can be broken down into smaller questions like:
- Which product categories generate the highest profit?
- Which products sell frequently but have low margins?
- Are discounts helping increase profit or reducing it?
- Which months consistently perform best?
- Which customer segments spend the most?
Each of those questions helps define what should be measured.
The same approach applies in HR.
If a company wants to reduce employee turnover, useful questions might include:
- Which departments have the highest resignation rates?
- Are employees leaving within the first year?
- Is turnover higher in certain job levels?
- Does salary affect retention?
Turning a business goal into questions creates a strong foundation for KPI planning because it connects business strategy with measurable analysis.
Choose KPIs That Are Specific and Measurable
A KPI should be clear enough that anyone reviewing the report can understand what it measures.
The strongest KPIs usually have four characteristics:
1. They are specific
Avoid vague labels.
Instead of saying:
“Sales performance”
Use something measurable like:
“Monthly revenue growth percentage”
Specific KPIs create clearer reporting and reduce confusion.
2. They are measurable
A KPI must be based on data that can actually be calculated.
Examples include:
- Total revenue
- Average shipping days
- Number of new customers
- Employee turnover percentage
If it cannot be measured consistently, it becomes difficult to track progress.
3. They are relevant
A KPI should directly support the goal.
If the goal is faster shipping, then average delivery time matters.
Website traffic probably does not.
Relevance helps keep analysis focused.
4. They can be tracked over time
A KPI becomes more valuable when trends can be monitored.
Examples:
- Weekly sales growth
- Monthly retention rate
- Quarterly profit margin
This helps teams compare performance and measure improvement.
A simple checklist before choosing a KPI:
✔ Does it support the main goal?
✔ Can it be measured accurately?
✔ Is the data available?
✔ Can it be tracked consistently over time?
If the answer is yes, the KPI is likely useful.
Check Data Availability Before Finalizing KPIs
This is one of the most practical but overlooked steps.
Sometimes a KPI sounds perfect in theory, but the data needed to calculate it does not exist.
For example, imagine you want to calculate customer lifetime value.
That usually requires:
- Customer ID
- Purchase history
- Order dates
- Repeat transaction data
But if the dataset only includes:
- Product name
- Quantity
- Price
then the KPI becomes difficult or impossible.
Before finalizing KPI targets, check:
- Which columns are available?
- Are there missing values?
- Is the data clean?
- Is the time period enough?
- Are important identifiers included?
For shipping analysis, useful fields might include:
- Order date
- Ship date
- Delivery date
- Shipping method
From there, you can calculate:
- Average shipping days
- Delayed shipment percentage
- Delivery performance by shipping type
Strong KPIs depend on reliable data.
Focus on a Small Number of Important KPIs
One common mistake is trying to measure everything.
More KPIs do not automatically create better analysis.
In many cases, fewer KPIs create stronger reports because they make the main insights easier to understand.
For an e-commerce dashboard, a focused KPI set could include:
- Total revenue
- Conversion rate
- Average order value
- Profit margin
- Repeat purchase rate
For an HR dashboard:
- Total employees
- Employee turnover rate
- Average tenure
- Turnover by department
- Monthly resignation count
A smaller KPI set helps teams focus on priorities and prevents dashboards from becoming crowded.
Real Example: Retail Sales Analysis
Let’s look at a practical example.
A retail business wants to improve profitability.
The goal is clear:
Increase profit over the next quarter.
Questions include:
- Which products generate the highest profit?
- Which categories have strong revenue but weak margins?
- Which months perform best?
KPIs selected:
- Total monthly profit
- Profit margin by category
- Revenue per customer
- Top products by profit
- Monthly sales growth
After analysis, the company finds:
- Office supplies sell frequently but profit margins are low.
- Technology products generate fewer transactions but significantly higher profit.
- Sales increase strongly in November and December.
Because the KPIs were clearly defined before analysis, the findings immediately support decisions.
The business can:
- Promote higher-margin products
- Adjust pricing strategy
- Prepare inventory earlier for peak season
The analysis becomes useful because the KPI structure was already clear.
Real Example: HR Employee Analysis
Another example comes from HR.
A company notices increasing resignations.
The goal:
Reduce employee turnover.
Questions:
- Which department has the highest turnover?
- How long do employees stay before leaving?
- Are newer employees leaving faster?
KPIs:
- Employee turnover rate
- Average tenure
- Department turnover percentage
- Monthly resignation count
- First-year retention rate
Analysis reveals:
- Customer service has the highest turnover.
- Many employees leave within six months.
- Employees with shorter onboarding periods resign more often.
The company responds by improving onboarding and monitoring workload more closely.
Again, KPIs helped turn data into action.
Final Thoughts
Defining KPIs before starting data analysis creates structure, saves time, and makes the final insights more meaningful.
Instead of analyzing everything and hoping something useful appears, you begin with a clear direction and use data to answer specific business questions.
A simple process works well:
- Define the business goal
- Turn it into practical questions
- Choose measurable KPIs
- Check data availability
- Focus on the most important metrics
When this process is done well, analysis becomes easier to manage and much more valuable.
The goal is not just finding numbers.
The goal is understanding what those numbers mean and using them to make better decisions.
That is where effective data analysis creates real impact.
Need Help Defining KPIs or Analyzing Your Data?
If you are working with sales reports, operational data, HR datasets, or building dashboards for your business and need help defining the right KPIs before analysis, I would be happy to connect.
Visit kenchristn.com to explore my portfolio and recent data analysis projects.
You can also reach out through the contact page if you need support with:
- Data cleaning and preparation
- KPI planning and business reporting
- SQL analysis
- Dashboard creation in Looker Studio
- Reporting with Microsoft Excel
- Turning raw data into actionable business insights
Let’s turn your data into insights that support better decisions.