
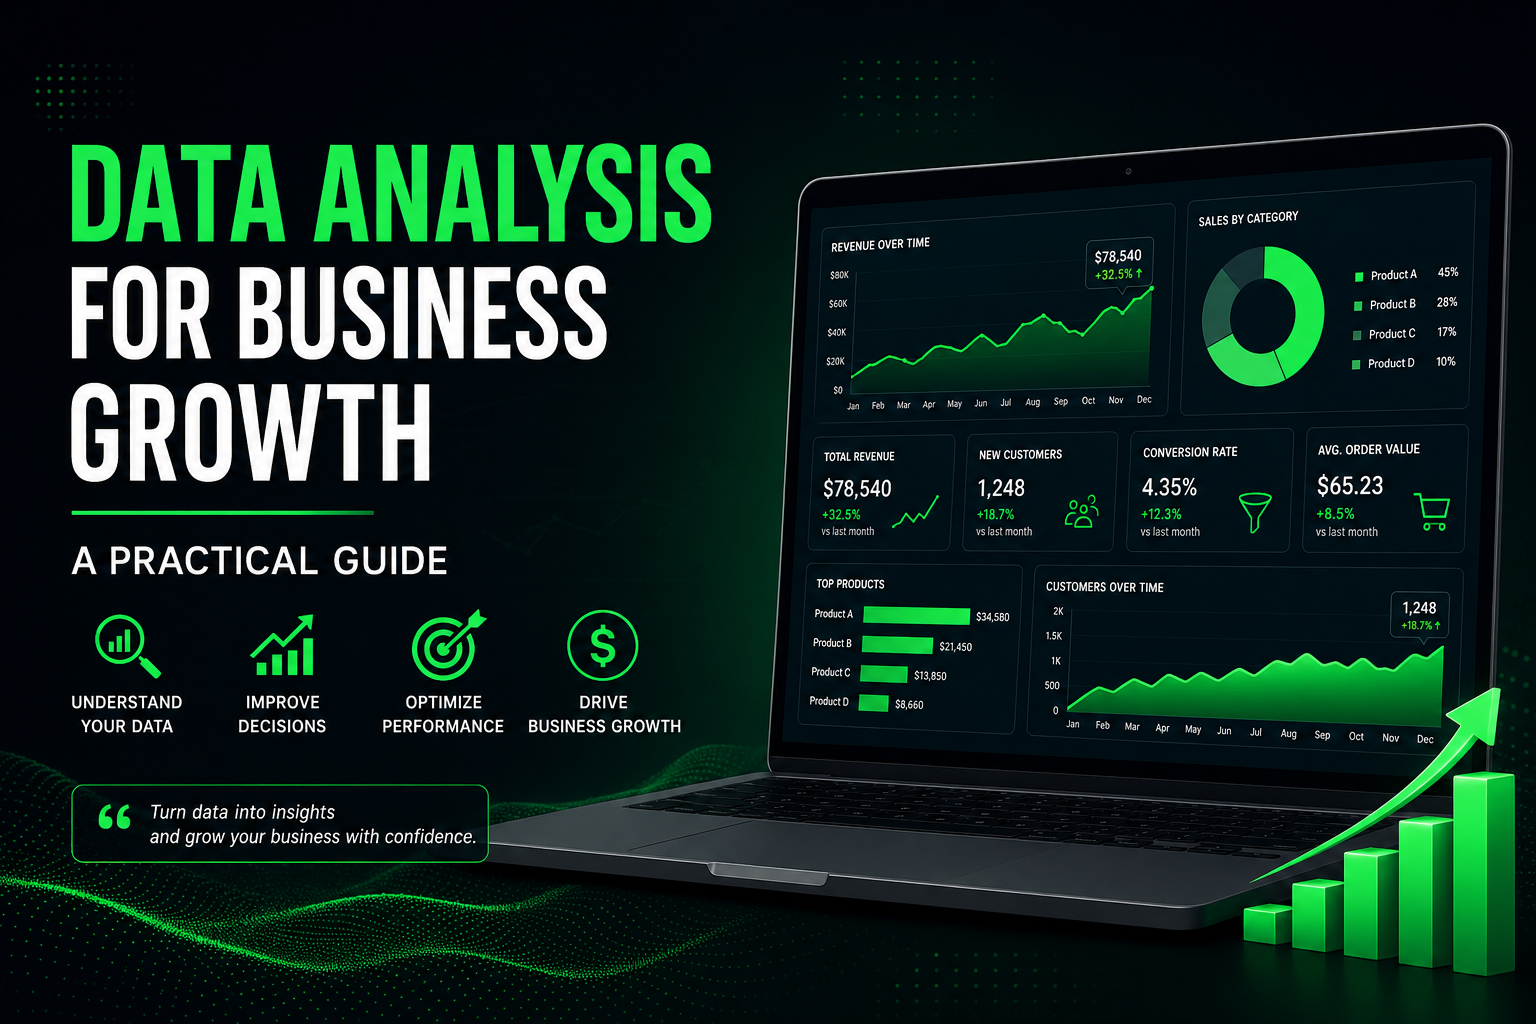
Data analysis helps businesses understand performance and make better decisions. Today, many companies use data analysis to improve efficiency, increase revenue, and discover growth opportunities. Instead of relying on guesswork, teams can use real numbers to guide action. As a result, business planning becomes clearer and more effective.
Every business creates data each day. Sales reports, customer interactions, website visits, and campaign results all provide useful information. However, data only becomes valuable when it is reviewed and turned into action. Therefore, learning how to use data analysis is an important step for business growth.
This practical guide explains seven smart ways to use data analysis in business. In addition, each strategy is simple enough to apply whether you run a small business or manage a growing team.
1. Data Analysis Helps Track Sales Performance
Sales numbers often show the clearest picture of business health. Therefore, reviewing them regularly helps teams understand growth patterns. It also makes planning easier.
Important sales metrics include:
- Monthly revenue
- Conversion rate
- Average order value
- Repeat purchases
- Product performance
For example, one product may sell more during a certain season. Because of that, inventory and promotions can be adjusted earlier.
Meanwhile, regular sales reviews help businesses respond faster when revenue slows down.
2. Data Analysis Improves Customer Understanding
Customer behavior creates useful patterns. These patterns show what people buy, how often they return, and which channels bring the most value.
Useful customer metrics:
- New customers
- Returning customers
- Purchase frequency
- Customer lifetime value
- Website behavior
- Bounce rate
For example, customers may spend more time on one service page. Therefore, that page may deserve stronger promotion.
In addition, customer insights often improve retention and increase repeat business.
3. Data Analysis Supports Better Marketing Decisions
Marketing campaigns create measurable results. However, not every campaign performs equally well.
By using data analysis, businesses can review:
- Website traffic
- Email open rates
- Click-through rate
- Cost per lead
- Conversion performance
For example, Google Analytics helps businesses understand traffic and user behavior.
As a result, businesses can spend more on high-performing channels and reduce waste.
Meanwhile, campaign performance becomes easier to compare over time.
4. Build a Simple Dashboard to Monitor Business Growth
Dashboards make reporting easier. Instead of checking several spreadsheets, teams can review everything in one place.
A useful dashboard may include:
- Revenue trend
- Customer growth
- Sales by category
- Marketing performance
- Business KPIs
Tools like Google Looker Studio and Microsoft Excel work well.

Most importantly, dashboards save time.
They also help teams react faster because information is easier to see.
If you want a practical example of analytics and predictive modeling, you can explore my project on Heart Disease Prediction Using Machine Learning. It shows how data analysis and machine learning can turn raw datasets into useful insights.
5. Identify Problems Earlier With Data Analysis
Small problems often become bigger when teams do not notice them early.
Data analysis helps identify:
- Lower sales
- Higher refund rates
- Rising costs
- Lower website conversions
- Customer retention decline
For example, a sudden drop in conversions may point to a broken page.
Because of that, teams can fix the issue faster.
As a result, businesses protect revenue and reduce delays.
6. Forecast Future Growth
Forecasting helps businesses prepare.
Historical data often reveals useful patterns. Therefore, businesses can estimate future needs more accurately.
Forecasting may include:
- Revenue targets
- Staffing plans
- Budget planning
- Inventory demand
- Campaign budget
No forecast is perfect.
However, having reliable estimates helps teams plan with more confidence.
Likewise, forecasting supports long-term growth.
7. Turn Data Analysis Into Action
Collecting information is useful. Taking action matters more.
A simple workflow:
Collect
Gather sales and business data.
Clean
Remove errors.
Analyze
Look for patterns.
Visualize
Use dashboards and charts.
Decide
Take action.
Review
Track results and improve.
This process keeps reporting useful.
In addition, it creates consistent decision-making.
Common Mistakes to Avoid
Businesses often collect too much data.
That can slow reporting.
Instead, focus on the metrics that matter most.
Avoid:
- Tracking too many numbers
- Ignoring data quality
- Updating reports too late
- Not reviewing results regularly
- Taking no action after analysis
Simple reporting usually works better.
Therefore, keep dashboards practical.
How Small Businesses Can Start
You do not need advanced tools.
A simple spreadsheet is enough.
Start with:
- Monthly revenue
- Customer inquiries
- Website traffic
- Marketing results
- Weekly dashboard review
Then improve the system over time.
Meanwhile, automation can save even more time.
Final Thoughts
Data analysis helps businesses grow with more clarity.
It improves decisions.
It helps teams find problems earlier.
It also creates stronger planning.
Most importantly, data analysis turns numbers into action.
Start small.
Review your results often.
Then improve based on what the data shows.
Over time, even small improvements can create meaningful business growth.
Need Help With Data Analysis for Business Growth?
If you want clearer reporting, better dashboards, or more useful business insights, I’d be happy to help.
Visit kenchristn.com to explore my portfolio and recent projects in data analysis, dashboards, and AI automation.
You can reach out for help with:
- Business data analysis and reporting
- KPI tracking and dashboard creation
- SQL analysis and data processing
- Data visualization for decision-making
- Sales and customer performance insights
- Turning raw business data into actionable recommendations
Let’s turn your business data into smarter decisions and measurable growth.