
Data Analysis
Customer Behavior & Retention Analytics for Olist Brazilian E-Commerce
Overview
This project was developed to understand customer behavior across the Olist marketplace and identify opportunities to improve long-term customer retention.
Using Google BigQuery, customer transaction data was transformed into structured customer-level metrics. Python was then used for analysis and visualization, while Looker Studio was used to create an interactive dashboard.
The project combines SQL querying, data analysis, and business-focused dashboard reporting into one end-to-end workflow.
Objectives
- Analyze monthly customer acquisition trends
- Measure returning customer behavior
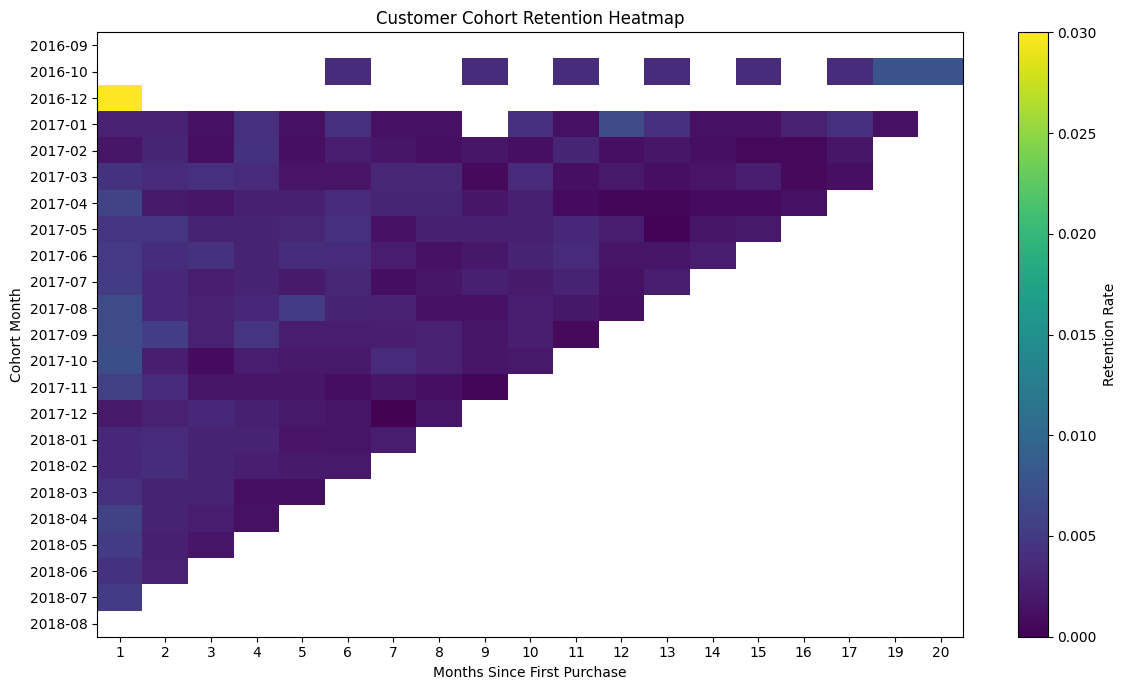
- Evaluate customer retention through cohort analysis
- Segment customers based on purchase behavior
- Generate actionable retention recommendations
Tech Stack






Dataset
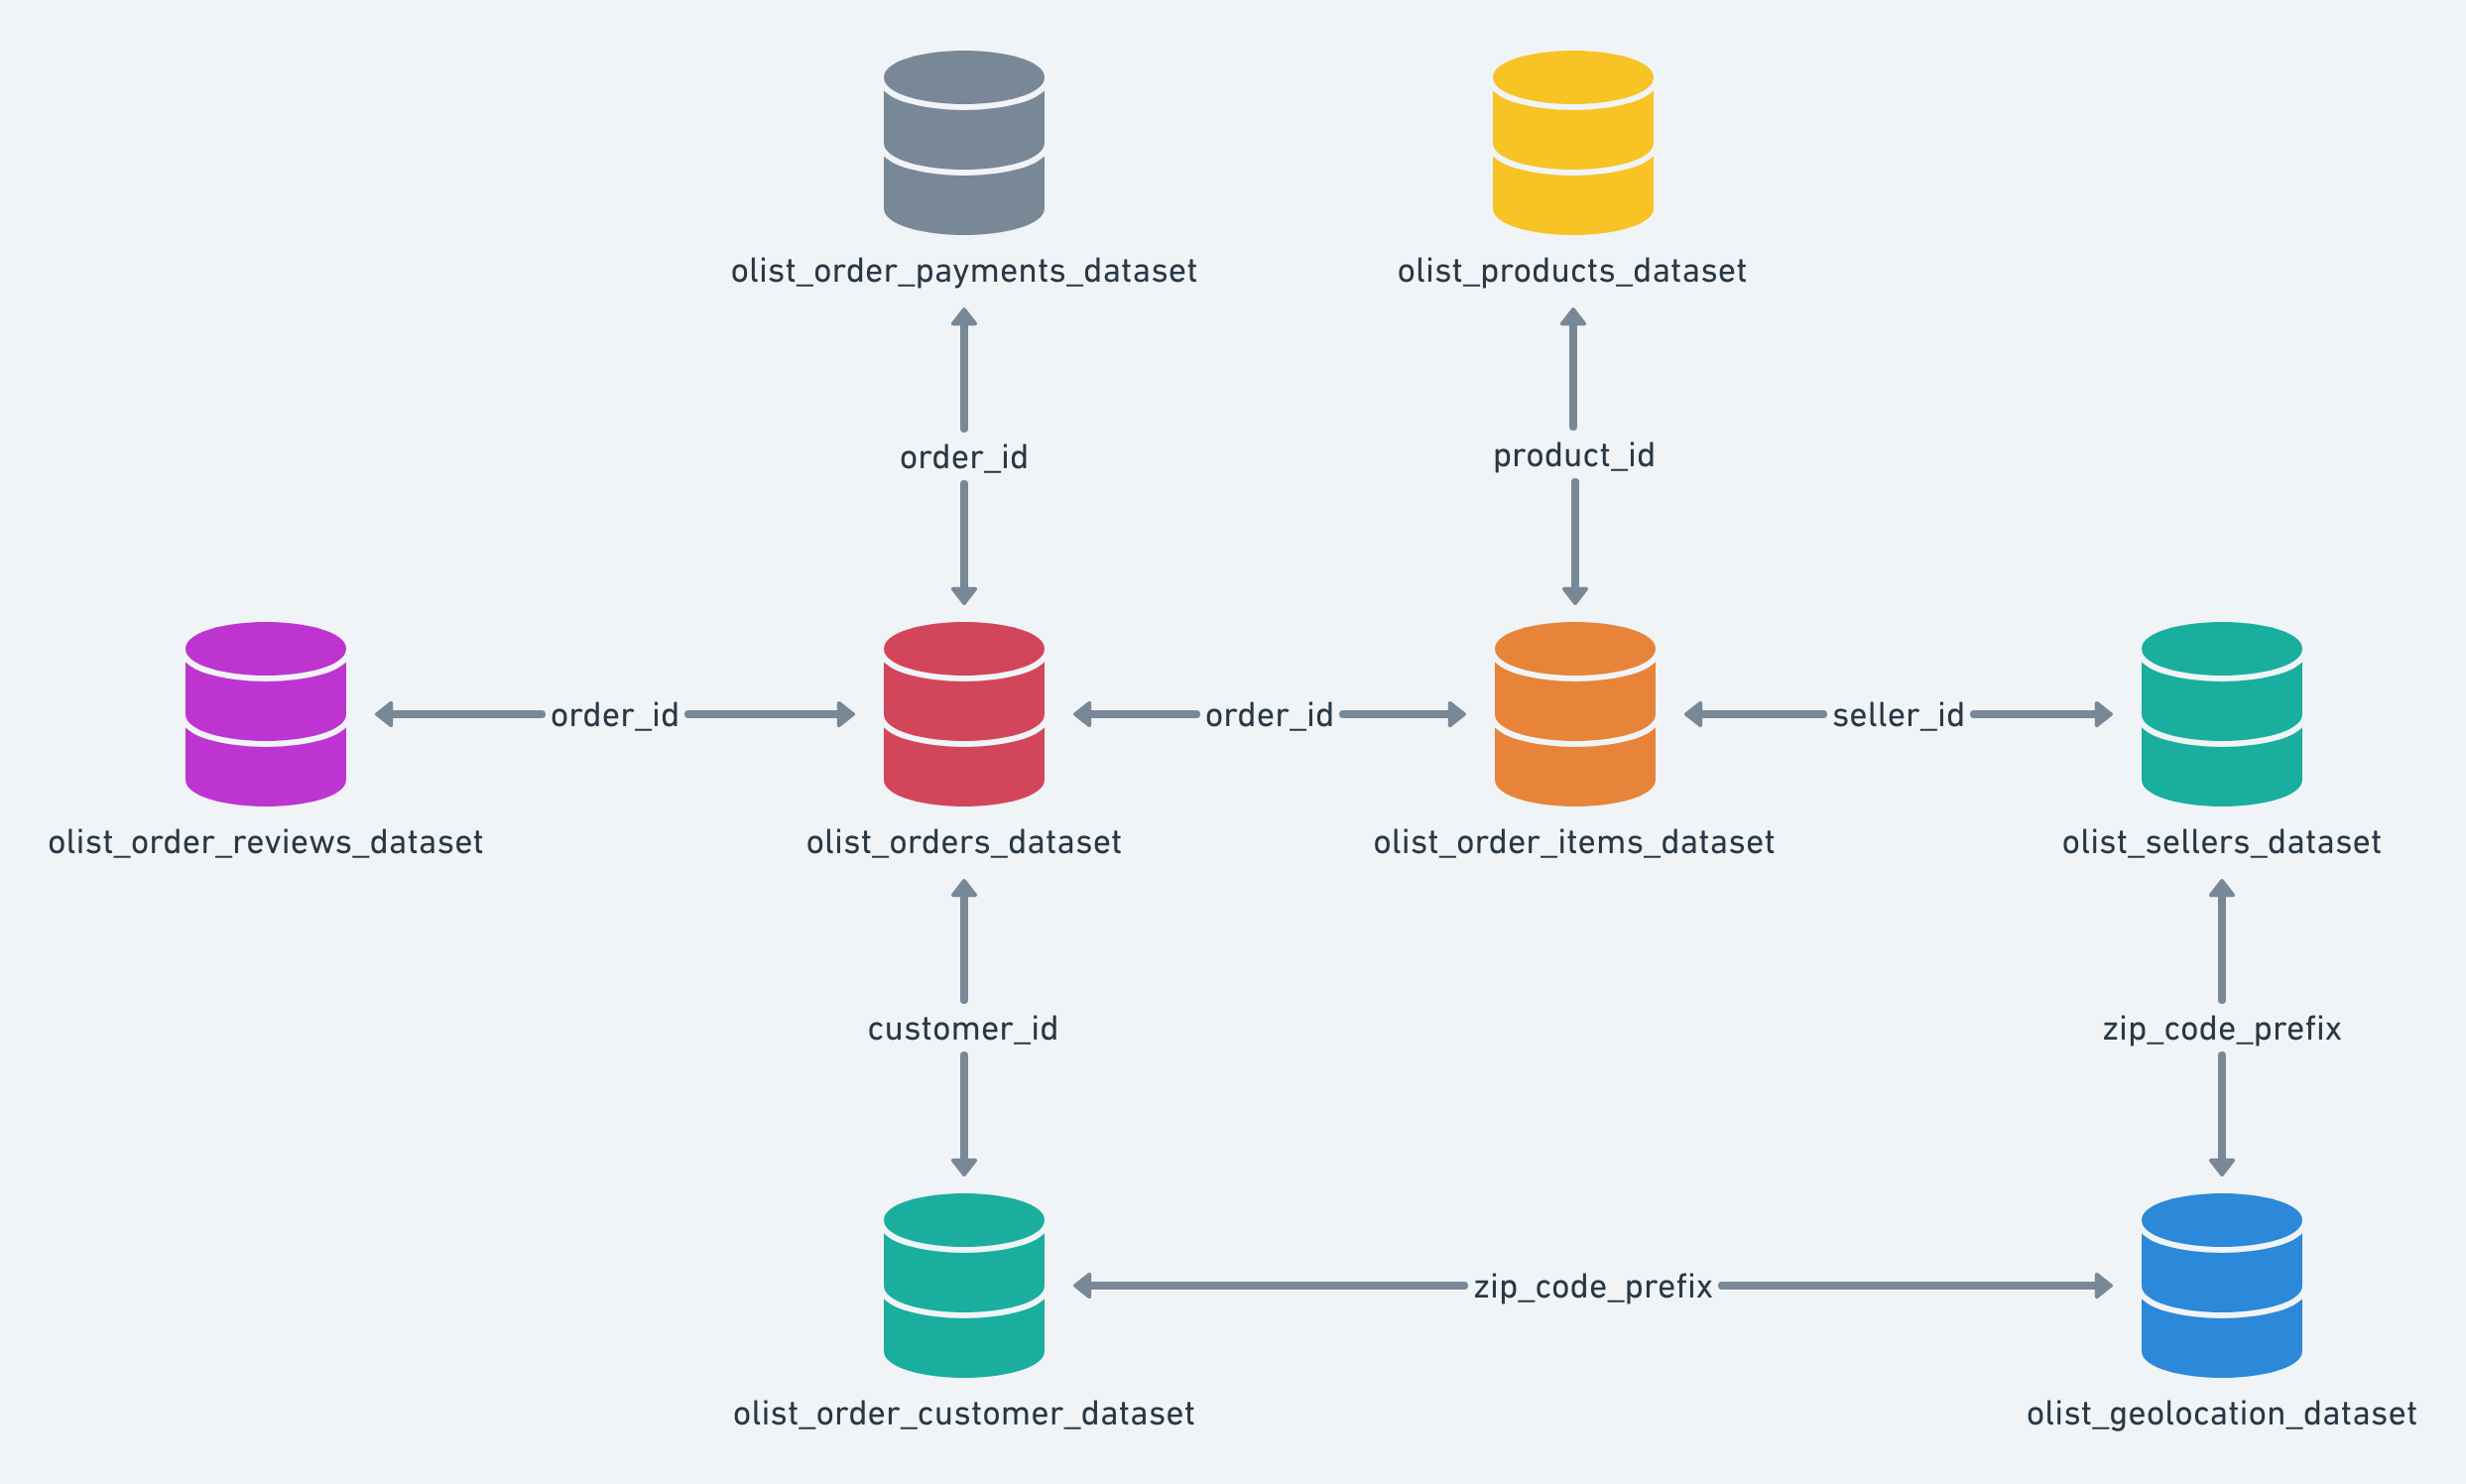
- customers — customer profile data including customer ID and location
- orders — order lifecycle information including purchase timestamps and delivery status
- order_items — product-level transaction details used for revenue calculation
- order_payments — payment amount and payment method for each transaction
- order_reviews — customer review scores used for customer satisfaction analysis
- products — product catalog information
- sellers — seller information and marketplace participation
- geolocation — customer and seller geographic reference
- product_category_name_translation — category translation reference
- customer_master (derived table) — consolidated customer-level table containing purchase history, revenue, review metrics, and customer engagement indicators
Data Schema
Workflow
- Validated table availability and schema consistency
- Checked missing values and duplicate records
- Reviewed customer and transaction relationships
- Confirmed join key consistency across tables
- Joined customer and transaction tables
- Aggregated purchase history into customer-level metrics
- Calculated total orders and total revenue
- Measured average review score per customer
- Created a consolidated customer-level analysis table
- Calculated each customer’s first purchase month
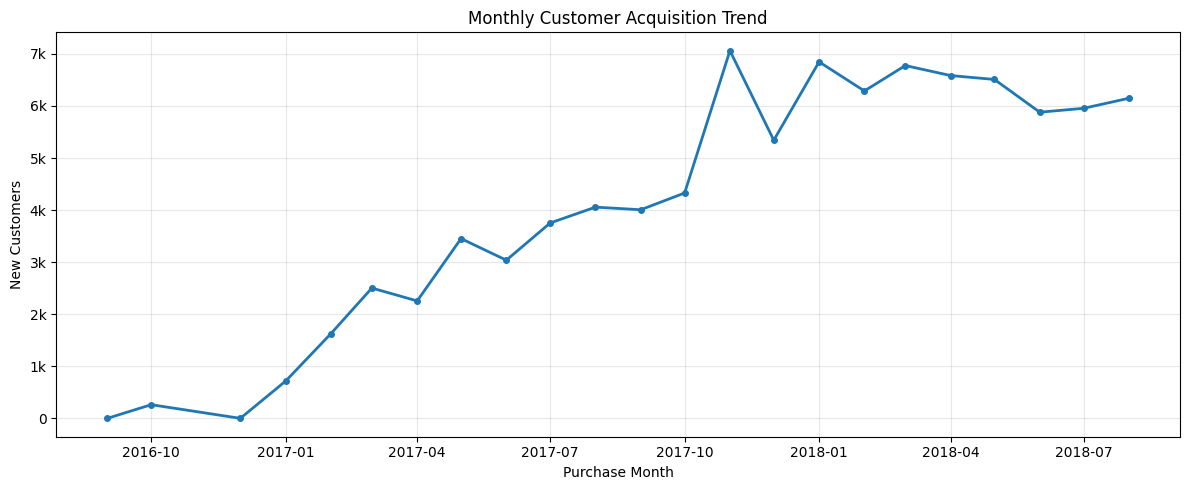
- Aggregated monthly new customer count
- Identified acquisition growth trends over time
- Measured marketplace expansion throughout the analysis period
- Identified repeat customers based on multiple purchases
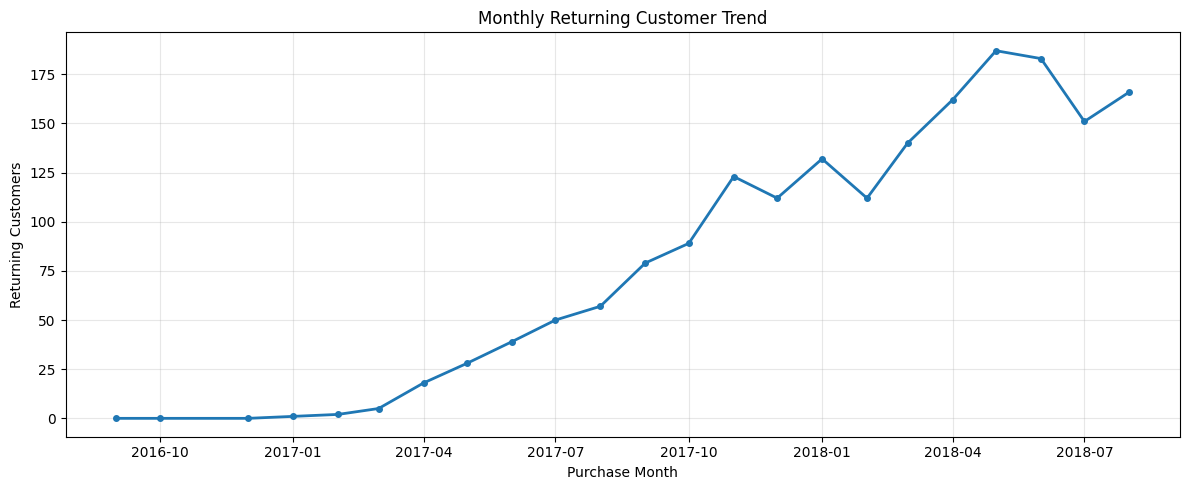
- Measured monthly returning customer volume
- Evaluated repeat purchase consistency over time
- Compared customer retention trend across periods
- Grouped customers by first purchase month
- Calculated retention activity across monthly cohorts
- Measured repeat purchases over time
- Visualized retention patterns using a cohort heatmap
- Classified customers into behavioral segments
- Compared customer distribution across segments
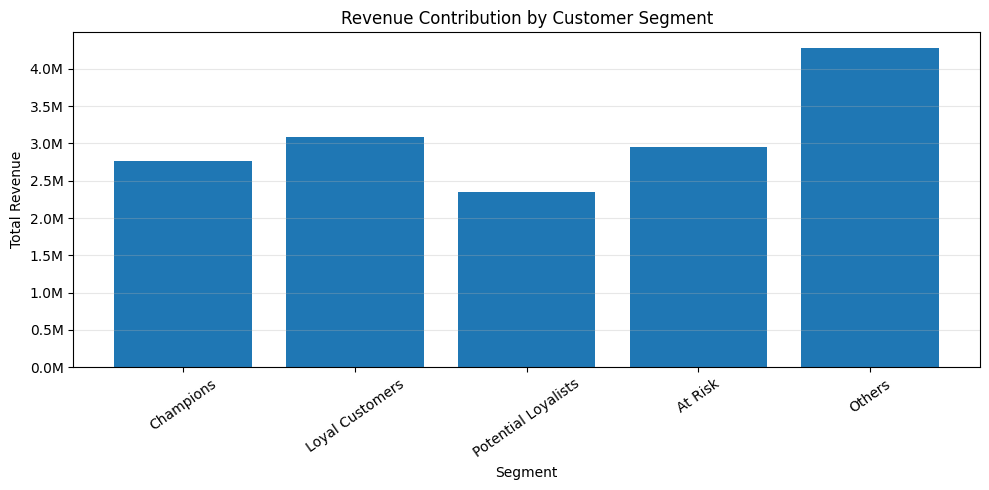
- Measured revenue contribution by segment
- Identified high-value customer groups
- Highlighted retention opportunities by segment
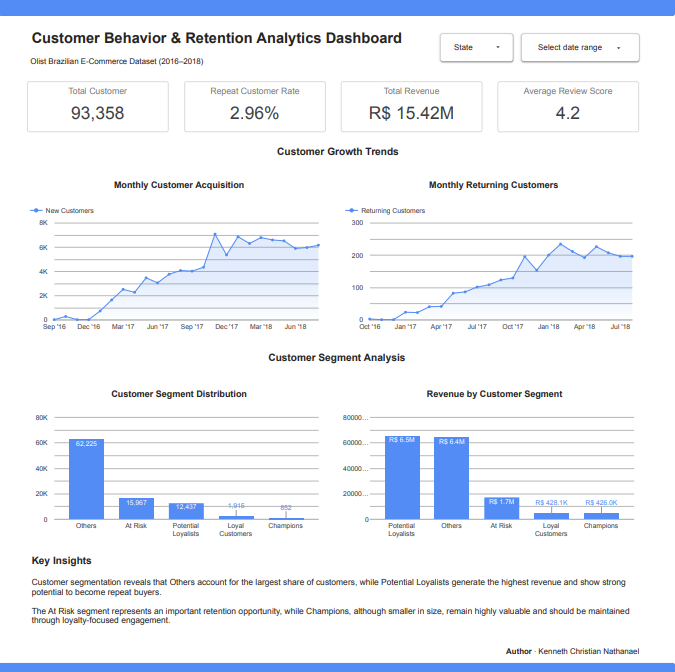
- Built KPI scorecards for customer and revenue metrics
- Added acquisition and retention trend charts
- Added customer segmentation visualizations
- Created interactive filters for state and date range
- Published dashboard in Looker Studio
- Identified customer retention opportunities
- Highlighted revenue-driving customer groups
- Summarized purchasing behavior trends
- Generated actionable business recommendations
SQL Analysis
Google BigQuery was used for data validation, transformation, and analytical query development across the Olist dataset.
The SQL workflow started with validating source tables and reviewing relationships between customers, orders, payments, and reviews. After validation, multiple transactional tables were transformed into a consolidated customer_master table containing customer-level metrics such as total orders, total revenue, average order value, and review score.
Additional SQL queries were then created to measure customer acquisition, returning customer activity, cohort retention, and customer segmentation. These outputs were later used as the foundation for Python visualization and dashboard reporting.
Insight
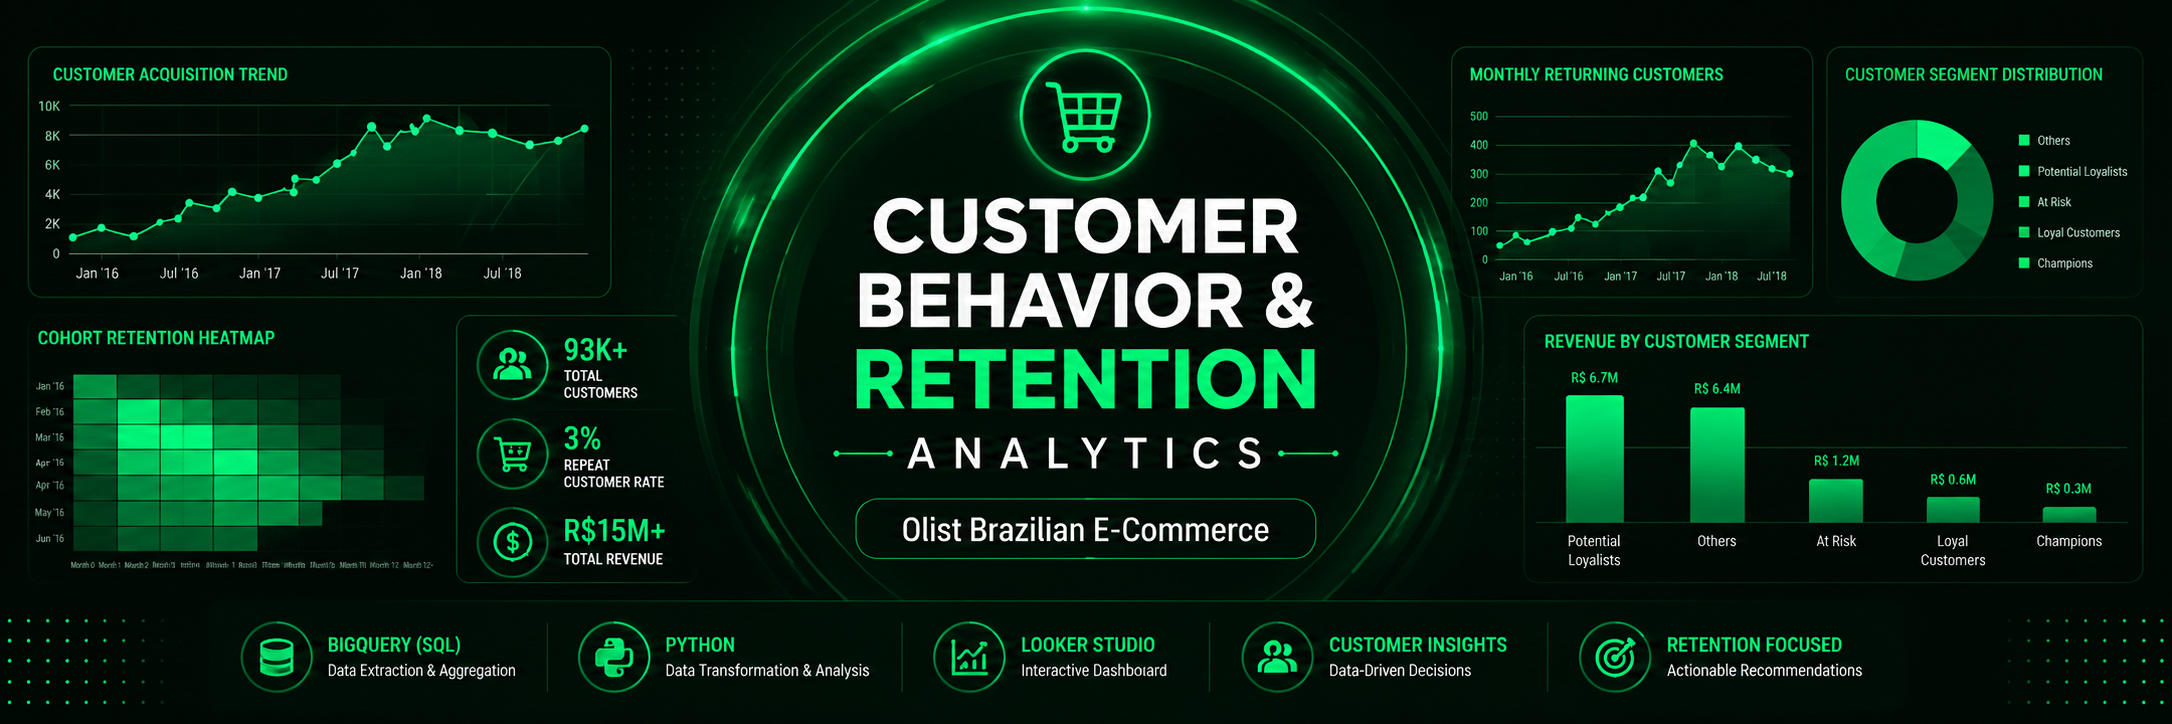
- The analysis identified more than 93K customers across the marketplace between 2016 and 2018, indicating strong platform scale and customer reach.
- Monthly customer acquisition increased steadily and reached its highest point near the end of 2017, showing strong marketplace growth during the expansion period.
- Returning customer activity also improved over time, although repeat customer rate remained relatively low at around 3%, meaning acquisition growth was significantly stronger than long-term retention.
- Cohort retention analysis showed that repeat purchases happened most frequently shortly after the first transaction, with customer retention gradually decreasing over time.
- SQL transformation created clean analytical views that were directly used in Python and Looker Studio, improving reporting consistency across the project.
Python Analysis
Python was used in Google Colab to visualize SQL outputs and support deeper exploratory analysis.
Using Pandas and Matplotlib, customer behavior trends were visualized through acquisition charts, returning customer trends, cohort retention heatmap, and segment-based analysis. This step made the SQL outputs easier to interpret and helped connect the analytical results with business-focused recommendations.
Python was also used to validate customer segmentation results and compare revenue contribution between different customer groups before building the final dashboard.
Insight
- Returning customer activity showed a positive upward trend, but repeat customer behavior remained limited compared with overall acquisition, reinforcing the need for stronger retention strategy.
- Cohort heatmap analysis confirmed that the strongest retention activity happened during the early months after first purchase, with repeat activity declining over longer periods.
- The Potential Loyalists segment generated the highest revenue contribution at approximately R$6.5M, despite having a smaller customer base than the largest segment.
- The Others segment represented the largest customer group with more than 62K customers, showing broad customer reach but lower average revenue contribution per customer.
- The At Risk segment accounted for nearly 16K customers, highlighting a meaningful opportunity for re-engagement and customer retention initiatives.
Monthly Customer Acquisition
Returning Customer Trend
Cohort Retention Heatmap
Revenue by Segment
Dashboard Preview
The final dashboard was built in Looker Studio to provide an interactive overview of customer behavior and retention performance.
It combines KPI scorecards, customer growth trends, segment analysis, and interactive filters into one reporting view.
Key Insights
- The analysis identified more than 93K customers across the Olist marketplace during the 2016–2018 period, showing strong customer acquisition and marketplace expansion.
- Monthly customer acquisition increased consistently and reached its highest point near the end of 2017, indicating strong marketplace growth during the peak expansion period.
- Repeat customer rate remained relatively low at around 3%, showing that customer acquisition performance was stronger than long-term customer retention.
- The Potential Loyalists segment generated the highest revenue contribution at approximately R$6.5M, highlighting strong upsell and repeat purchase potential.
- The Others segment represented the largest customer group with more than 62K customers, while the At Risk segment accounted for nearly 16K customers, revealing a meaningful opportunity for retention-focused strategy.
Recommendations
- Prioritize retention campaigns for the At Risk segment through re-engagement offers, personalized communication, and follow-up campaigns.
- Convert Potential Loyalists into repeat buyers through loyalty incentives and targeted upselling strategies.
- Monitor repeat customer rate monthly to track customer retention performance alongside acquisition growth.
- Expand customer analysis by product category and customer location to uncover more detailed behavioral patterns.
- Continue improving dashboard monitoring to support faster decision-making and strengthen long-term customer retention strategy.
Future Improvements
- Add geographic analysis by customer state and region to identify location-based customer behavior and retention patterns.
- Expand analysis by product category to understand which product groups contribute the strongest repeat purchase behavior.
- Calculate Customer Lifetime Value (CLV) to measure long-term customer contribution beyond individual transactions.
- Build a predictive churn model using machine learning to identify customers with a high risk of not returning.
- Connect the dashboard directly to live BigQuery tables to enable real-time reporting and easier ongoing monitoring.