
Machine Learning
Heart Disease Prediction Using Machine Learning
Overview
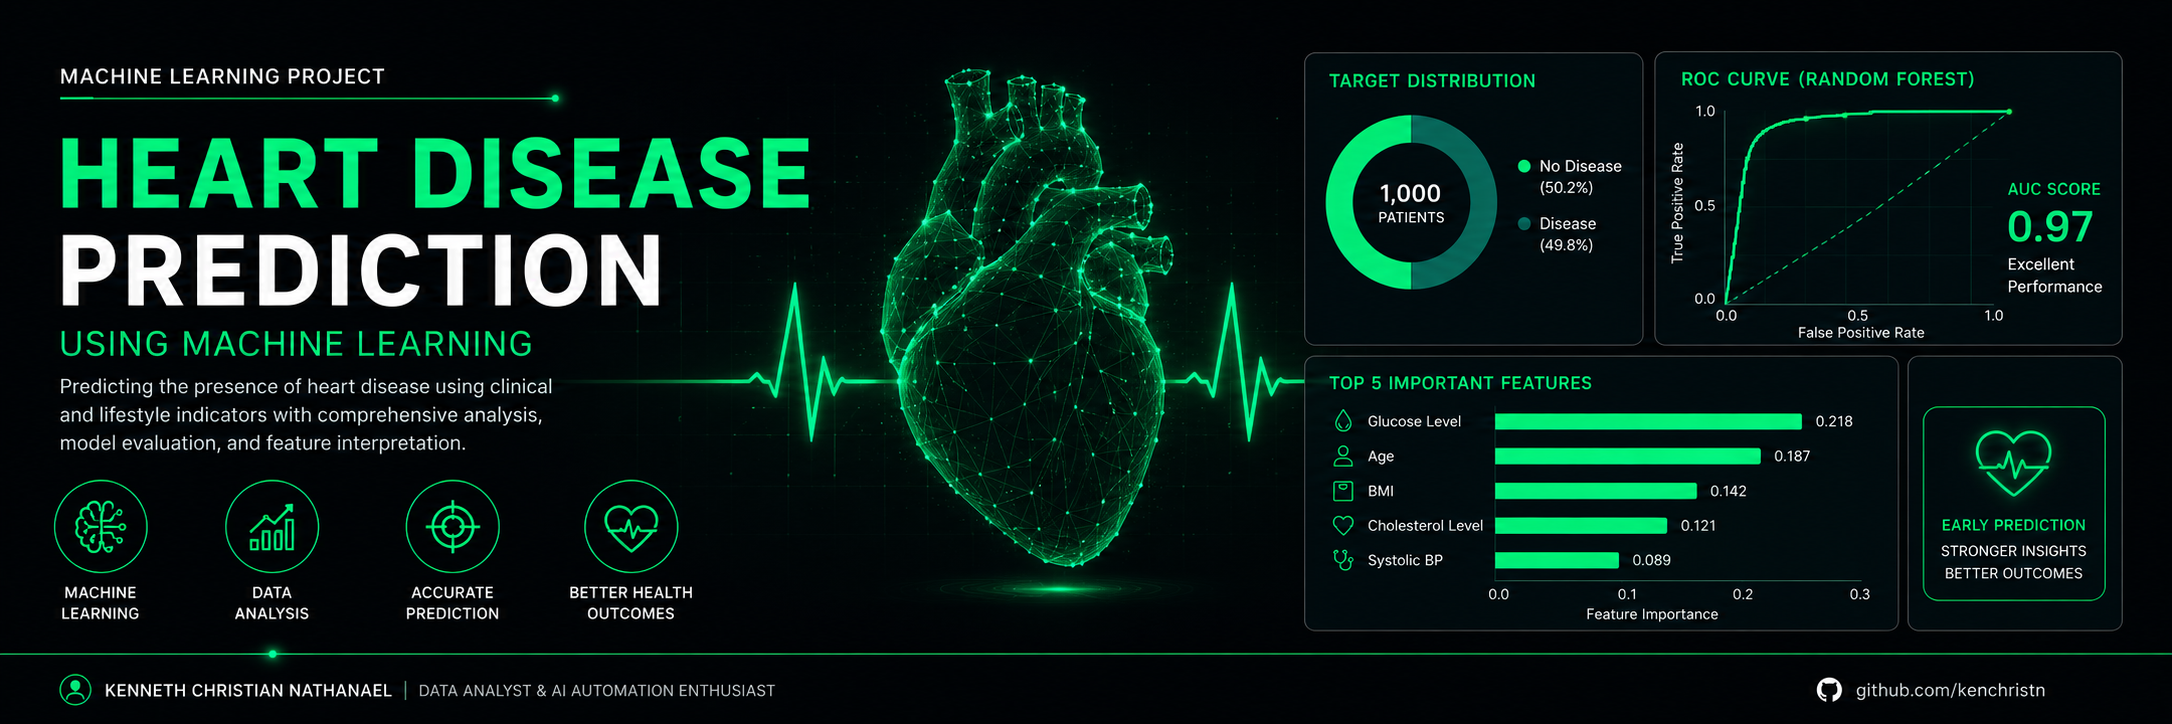
This project develops a machine learning classification model to predict whether a patient has heart disease based on patient clinical measurements and lifestyle indicators.
The dataset contains 1,000 patient records with features related to health condition, medical history, and behavior.
The goal is to identify heart disease risk and compare multiple machine learning models to determine which model performs best.
This project follows a complete machine learning workflow including:
- data exploration
- exploratory data analysis
- preprocessing
- model training
- evaluation
- hyperparameter tuning
- feature interpretation
The final model selected is Random Forest, which achieved the strongest performance.
Objectives
- Predict heart disease using patient clinical and lifestyle indicators
- Compare machine learning classification models
- Improve performance through hyperparameter tuning
- Identify the strongest predictors
- Interpret prediction results visually
Questions explored
- Which variables are most associated with heart disease?
- Which model performs best?
- Which features contribute most to prediction?
Tech Stack







Dataset
Source: Kaggle – Heart Disease Prediction Dataset
Main Dataset
disease_prediction.csv
Contains 1,000 patient records
Features
Clinical Indicators
- age
- glucose level
- cholesterol
- systolic blood pressure
- diastolic blood pressure
- BMI
- heart rate
Lifestyle Factors
- smoking
- alcohol consumption
- physical activity
Medical History
- family history
Target
- Yes → heart disease
- No → no heart disease
Workflow
- review dataset structure
- inspect column types
- summary statistics
- missing values
- duplicate rows
Goal: understand dataset quality before analysis
- target distribution
- numerical distribution
- correlation heatmap
- compare features vs disease
Goal: find patterns and relationships
- remove
patient_id - encode categorical columns
- train/test split
- standard scaling
Goal: prepare model-ready dataset
Train:
- Logistic Regression
- Decision Tree
- Random Forest
Goal: compare baseline performance
Exploratory Data Analysis
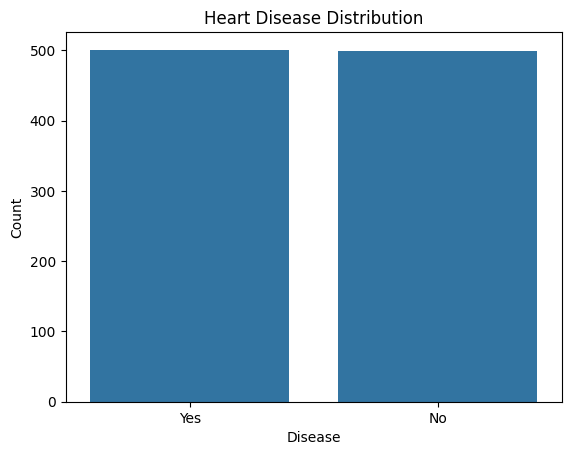
Target Distribution
The dataset is balanced between patients with heart disease and without heart disease.
This balanced distribution helps reduce bias during model training.
Numerical Feature Distribution
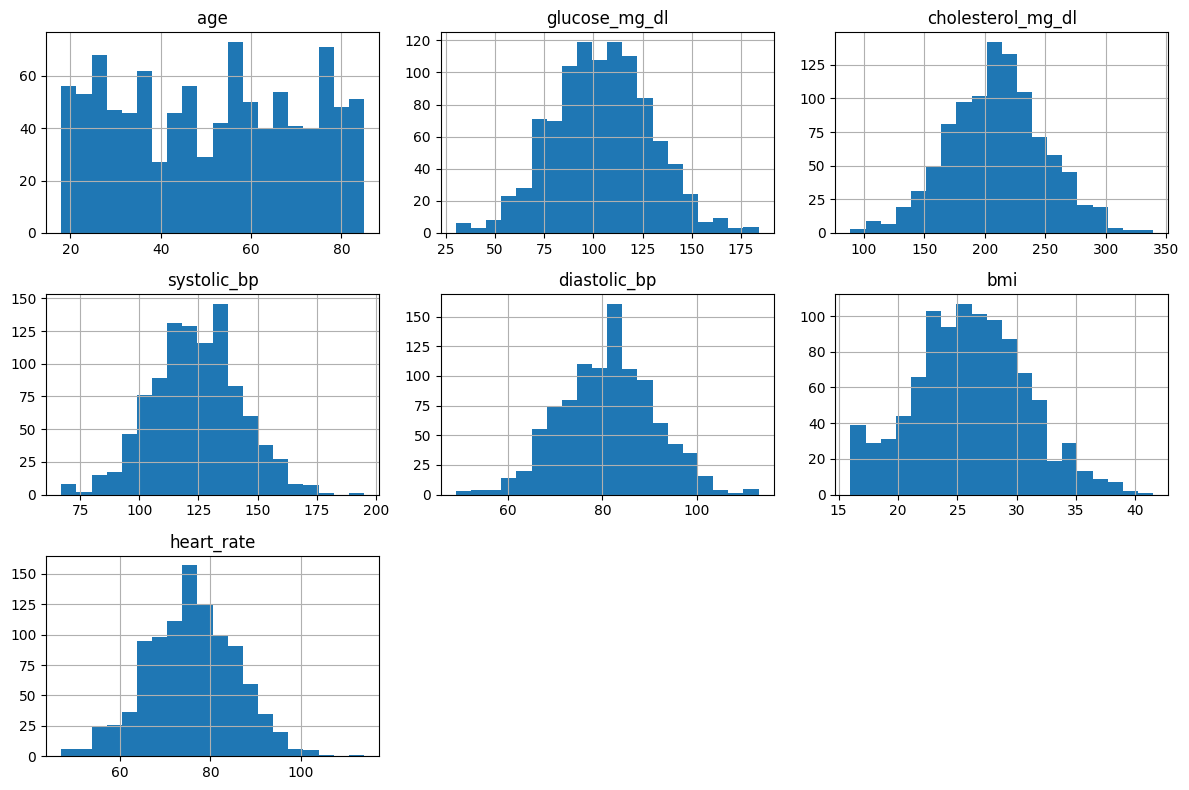
Most numerical features show normal or near-normal distribution.
-
Age : patients distributed between younger and older groups
-
Glucose : clustered around normal–moderate range
-
Cholesterol : relatively centered with several high values
-
Blood pressure : mostly around expected range
-
BMI : clustered in moderate range
-
Heart rate : stable distribution
Correlation Analysis
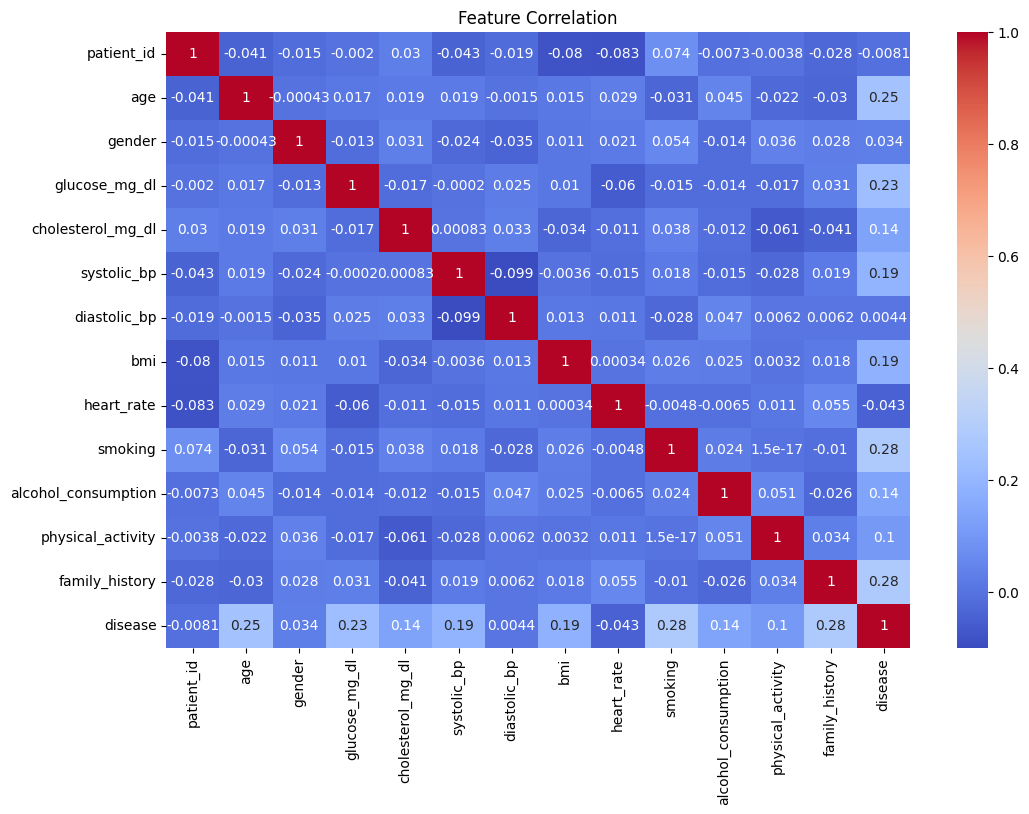
The correlation heatmap shows weak to moderate positive relationships with heart disease.
Stronger relationships appear in: smoking, family history, age, glucose
Lower correlation: gender, alcohol consumption
Feature Comparison Against Target
- Age vs Heart Disease : Patients with heart disease tend to be older.
- Cholesterol vs Heart Disease : Heart disease cases show slightly higher cholesterol.
- Family History vs Heart Disease : Family history increases risk.
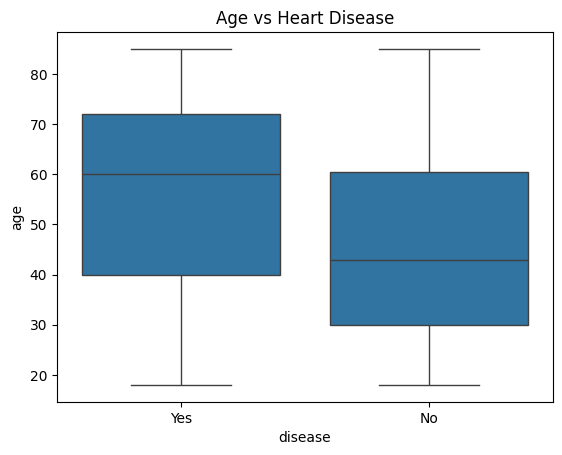
Age vs Heart Disease
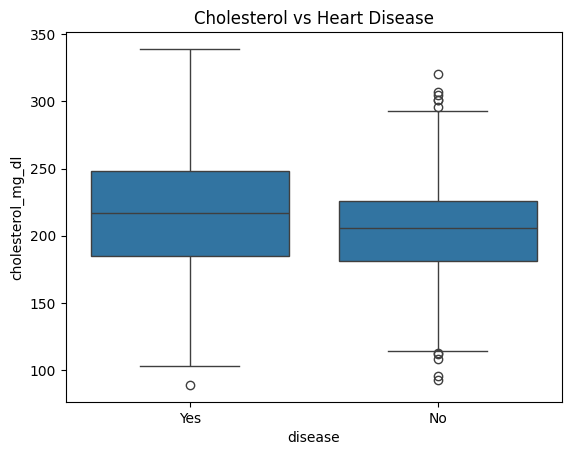
Cholesterol vs Heart Disease
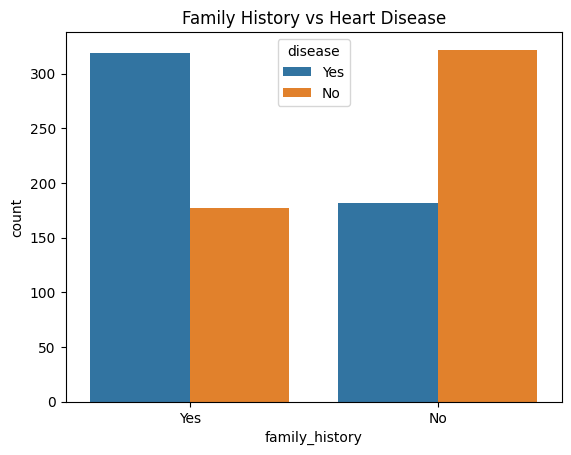
Family History vs Heart Disease
Model Performance
| Model | Accuracy | Precision | Recall | F1 |
| Logistic Regression | 0.74 | 0.75 | 0.72 | 0.73 |
| Decision Tree | 0.84 | 0.86 | 0.81 | 0.84 |
| Random Forest | 0.915 | 0.903 | 0.93 | 0.916 |
Three machine learning models were trained and evaluated:
- Logistic Regression
- Decision Tree
- Random Forest
Each model was compared using Accuracy, Precision, Recall, and F1 Score.
Logistic Regression performed well as a baseline model, while Decision Tree showed improved performance by capturing more complex patterns in the dataset.
Among all models, Random Forest achieved the best overall results:
- Accuracy: 91.5%
- Precision: 90.3%
- Recall: 93.0%
- F1 Score: 91.6%
The strong recall score is especially important because it shows the model was able to identify most patients with heart disease while keeping missed detections low.
Overall, Random Forest delivered the most balanced and reliable performance, making it the final model selected for this project.
Confusion Matrix
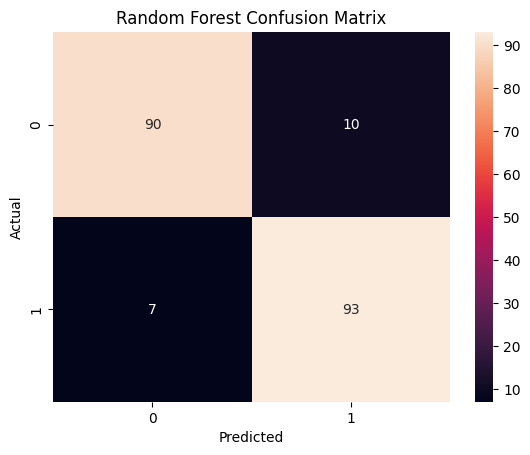
The confusion matrix provides a detailed view of how the final Random Forest model classified patients.
Unlike accuracy alone, this evaluation shows how many predictions were correct and where the model made mistakes.
- True Negative (90)
Patients without heart disease correctly predicted as negative. - False Positive (10)
Patients predicted as having heart disease when they actually did not. - False Negative (7)
Patients with heart disease predicted as negative. - True Positive (93)
Patients with heart disease correctly predicted as positive.
The model correctly classified most patients and maintained low prediction errors. A key result is the low number of false negatives.
In heart disease prediction, false negatives are especially important because they represent patients with heart disease that the model failed to detect.
With only 7 false negatives, the model shows strong ability to identify positive heart disease cases. This indicates that the model performs well not only in overall accuracy but also in practical classification reliability.
ROC Curve Analysis
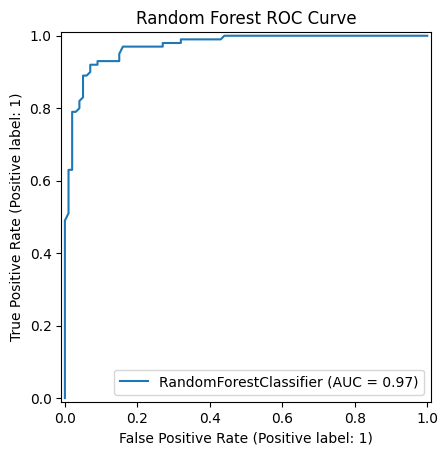
The ROC Curve evaluates the model’s ability to distinguish between patients with heart disease and patients without heart disease across multiple decision thresholds.
The curve compares:
- True Positive Rate (Sensitivity)
- False Positive Rate
The closer the curve is to the upper-left corner, the better the classification performance.
AUC = 0.97
An AUC score of 0.97 indicates excellent classification performance. This means the Random Forest model has a very strong ability to separate positive and negative cases.
In practical terms:
- patients with heart disease are highly likely to receive higher prediction scores
- patients without heart disease are correctly separated with low overlap
The ROC result confirms that the model remains stable across different classification thresholds and performs consistently beyond simple accuracy measurement. This strengthens confidence that the model generalizes well on unseen data.
Feature Importance
Feature importance helps explain which variables contributed most to the final prediction. This makes the Random Forest model more interpretable by showing which patient characteristics had the strongest influence.
Top predictors
- Glucose level
- Age
- BMI
- Cholesterol level
- Systolic blood pressure
Among all variables, glucose level showed the highest importance score, indicating that it contributed the most to prediction results. This suggests that patients with abnormal glucose levels were more strongly associated with heart disease in this dataset.
Age also showed strong influence, where older patients were more likely to be classified as having heart disease. This pattern is consistent with common cardiovascular risk factors.
Other clinical indicators such as BMI, cholesterol level, and systolic blood pressure also played important roles and helped strengthen prediction performance.
Lifestyle-related variables including smoking and physical activity contributed to the model as well, although their impact was lower than the main clinical measurements.
Meanwhile, alcohol consumption and gender showed the lowest contribution compared with other variables.
Overall, the feature importance analysis confirms that measurable clinical indicators were the strongest predictors of heart disease, with glucose level becoming the most dominant factor in the final model.
Key Insights
- The dataset was balanced between patients with and without heart disease, which helped reduce bias during model training.
- Clinical indicators such as glucose level, age, BMI, cholesterol, and systolic blood pressure showed the strongest contribution to prediction.
- Lifestyle factors including smoking and physical activity also influenced the results.
- Among all models tested, Random Forest delivered the best performance with 91.5% accuracy and 93.0% recall.
- The model showed strong ability to detect heart disease while maintaining low false negative predictions.
Recommendations
- Prioritize monitoring clinical indicators such as glucose level, blood pressure, cholesterol, and BMI because they showed the strongest relationship with heart disease.
- Include lifestyle factors such as smoking habits and physical activity as part of risk assessment.
- Use the model as an early prediction tool to help identify patients with higher heart disease risk.
- Combine prediction results with medical evaluation to support decision-making and improve screening efficiency.
Future Improvements
There are several opportunities to expand this project further and improve the depth of analysis.
- Use a larger and more diverse dataset to improve model generalization.
- Test additional machine learning models such as XGBoost or LightGBM.
- Apply cross-validation and threshold optimization for stronger evaluation.
- Build an interactive dashboard or web app for easier prediction and visualization.
- Add more clinical variables to improve prediction accuracy and model interpretability.