
Data Analysis
Retail Sales Performance Dashboard
Overview
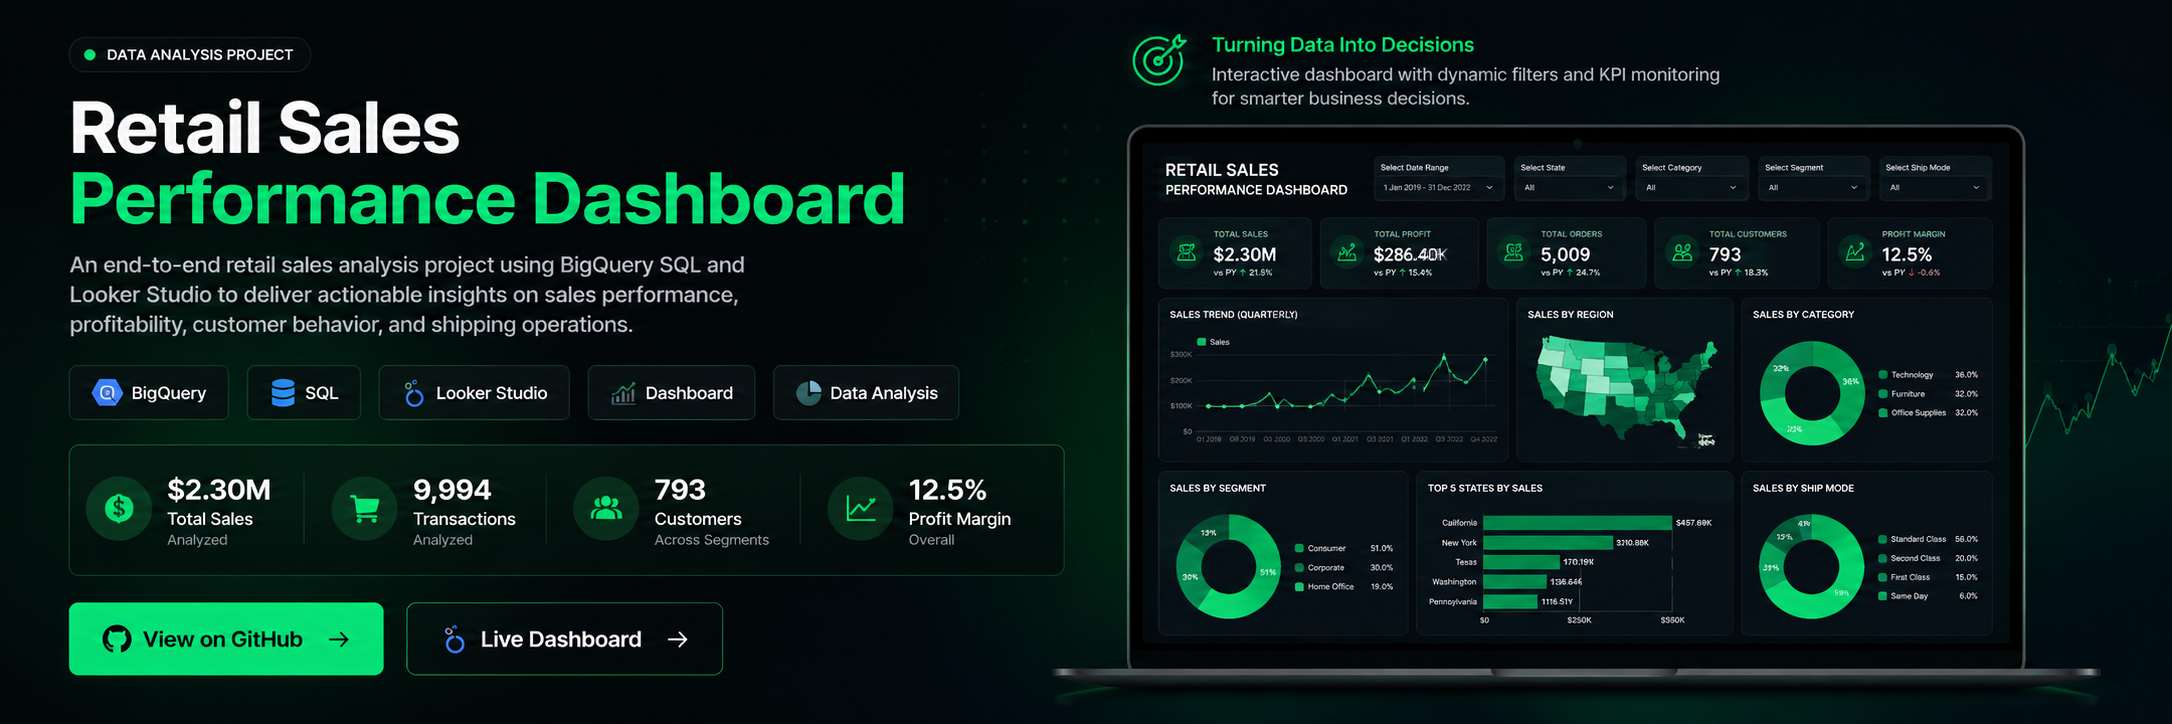
An end-to-end retail sales analysis project built using BigQuery SQL and Looker Studio to transform transactional retail data into interactive business insights.
This project analyzes the Superstore dataset to evaluate sales performance, profitability, customer contribution, and shipping operations across multiple regions, product categories, and customer segments.
The final dashboard was designed to support business decision-making through KPI tracking, profitability analysis, and operational performance monitoring in an interactive and stakeholder-friendly format.
Objectives
-
Analyze overall sales performance across time, product categories, and geographic regions
-
Identify profitable and loss-making products and evaluate category contribution
-
Measure how discount levels impact profit margin and business performance
-
Understand customer behavior through segment contribution and top customer analysis
-
Evaluate operational efficiency using shipping performance metrics
-
Build an interactive dashboard for stakeholder reporting and business decision support
Tech Stack


Dataset
The project uses two datasets:
The project uses the Superstore retail sales dataset containing transactional business records across products, customers, and regions.
Main columns include:
- Order ID
- Order Date
- Ship Date
- Customer Name
- Segment
- Region
- State
- Category
- Sub-Category
- Product Name
- Sales
- Quantity
- Discount
- Cost
- Profit
- Ship Mode
Workflow
Performed an initial validation process in BigQuery to review dataset quality and ensure all records were ready for analysis.
Tasks included:
• Checking null values across key columns
• Reviewing dataset structure and column consistency
• Validating order records and customer data
• Confirming sales and profit values before analysis
Analyzed retail sales performance to understand revenue trends across time, product categories, and geographic regions.
Analysis included:
• Annual sales trend
• Monthly sales trend
• Sales by region
• Sales by state
• Sales by city
• Sales by category
• Sales by sub-category
Evaluated business profitability to identify high-performing products and areas creating losses.
Analysis included:
• Top profitable products
• Top loss-making products
• Profitability by state
• Profit by category
• Profit by sub-category
• Discount impact on profitability
Analyzed customer contribution and segment behavior to understand purchasing patterns and customer value.
Analysis included:
• Customer contribution
• Segment analysis
• Top customers by profit
• Customer order frequency
• Customer distribution by state
Key Insights
-
West region generated the highest sales and strongest profit margin
-
Technology delivered the highest profitability across all categories
-
Furniture generated strong sales volume but weaker margins
-
Losses were concentrated in several products such as tables and bookcases
-
Higher discount levels were associated with lower profit
-
Consumer segment contributed the largest portion of total sales
-
A small number of customers generated a significant share of total profit
-
Standard Class handled the highest order volume while maintaining efficient shipping performance
Recommendations
-
Review discount strategy on low-margin and loss-making products
-
Prioritize high-margin product categories to improve profitability
-
Improve performance in underperforming regions and states
-
Strengthen retention strategy for high-value customers
-
Optimize shipping operations and improve slower delivery modes
-
Continue using dashboard reporting for regular performance monitoring
Future Improvements
There are several opportunities to expand this project further and improve the depth of analysis.
- Add year-over-year and month-over-month growth metrics to monitor business performance trends more effectively
- Build product-level profit margin analysis to identify stronger pricing opportunities and optimize product strategy
- Add customer retention and repeat order analysis to better understand long-term customer value
- Expand operational analysis with shipping delay trends and delivery performance by state
- Build forecasting for sales and profit trends to support future business planning
- Add benchmark comparison between regions and categories for faster performance evaluation
- Continue improving dashboard usability with additional filters and more interactive drill-down views
- Connect the dashboard to a live data source for automated reporting and real-time business monitoring