
Introduction
If you’re working in data analytics — or trying to break into the field — there’s one skill that keeps showing up in every job description, every data workflow, and every analytics conversation: SQL.
SQL, which stands for Structured Query Language, is the standard language used to communicate with databases. It’s how analysts pull data, slice it, filter it, aggregate it, and turn raw records into meaningful business insights. Whether you’re analyzing customer behavior, building reports, or feeding data into machine learning models, SQL is almost always part of the process.
Here’s the thing though: a lot of people learn just enough SQL to get by. They know how to write a basic SELECT statement and call it done. But data analytics today demands more than that. Businesses are sitting on massive datasets and they need analysts who can go deeper — who understand how data relates across tables, how to write efficient queries, and how to translate business questions into clean, reliable SQL.
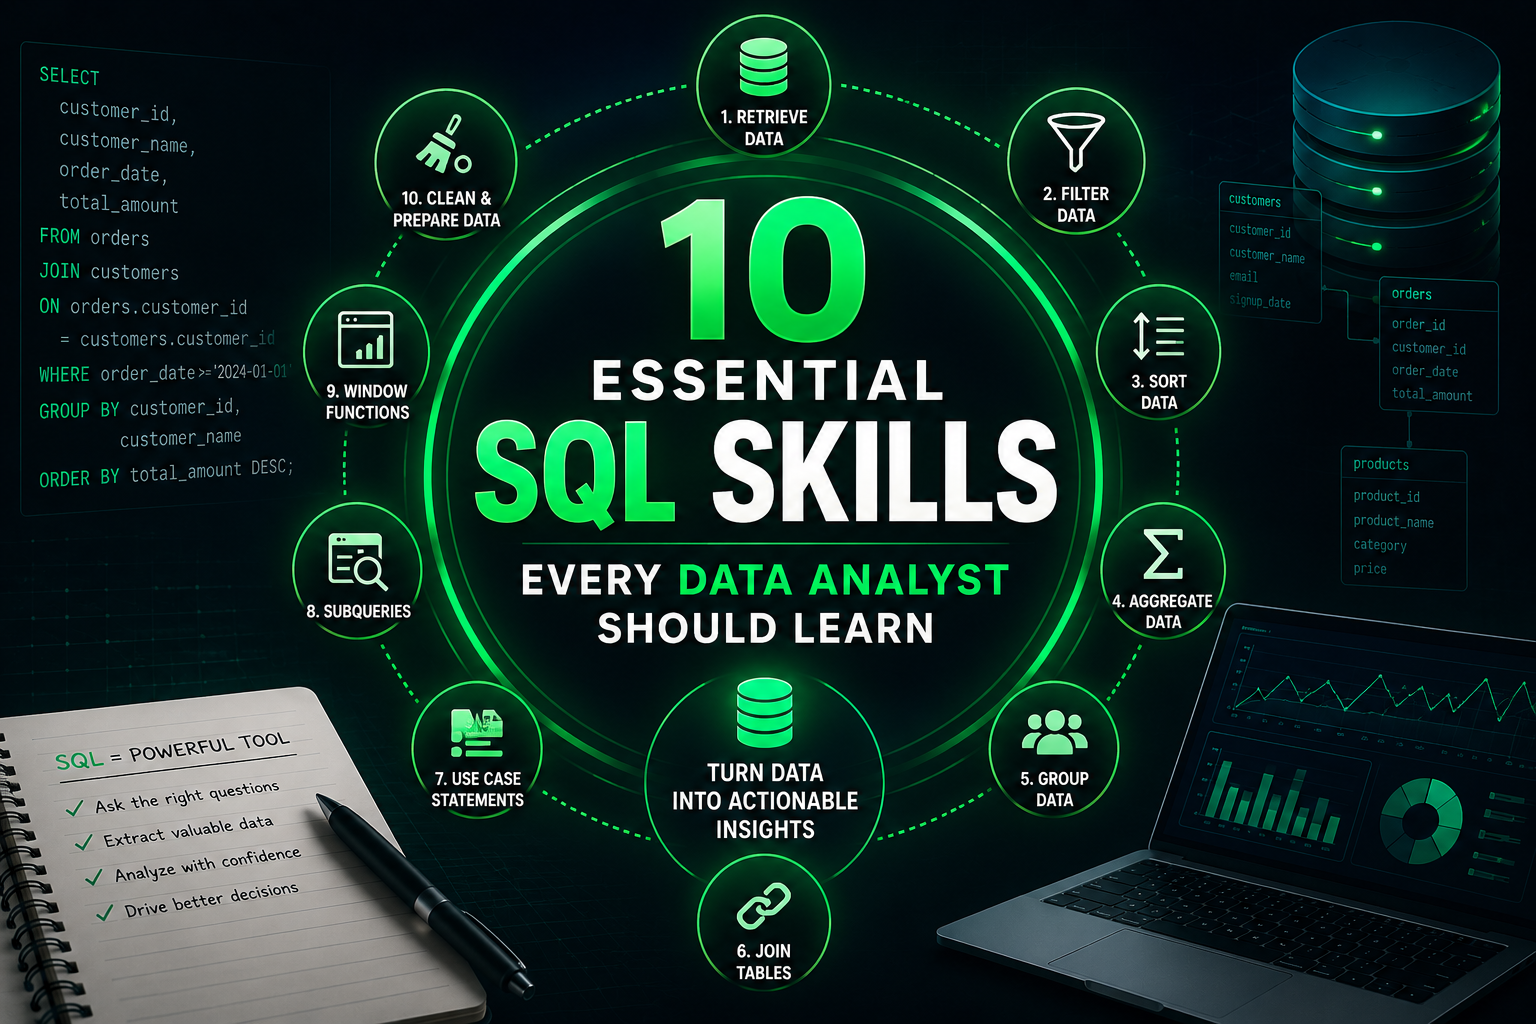
In this article, I’ll walk you through 10 essential SQL skills that every data analyst should develop. These aren’t just theoretical concepts — they’re the skills I’ve applied across real analytics projects, from e-commerce analysis to business intelligence dashboards. Whether you’re a beginner just starting out or someone looking to sharpen your SQL game, this guide will give you a clear picture of where to focus your energy.
Why SQL Still Matters in 2024 and Beyond
With so many modern tools available — Python, R, Power BI, Looker Studio, and even AI-powered analytics — you might wonder whether SQL is still worth your time. The short answer is yes, absolutely.
SQL is the universal language of data. It works across virtually every major data platform — whether you’re using BigQuery, Snowflake, PostgreSQL, MySQL, or any other relational database, SQL is how you interact with the data. Learning it well means you’re not locked into any one tool or platform.
From a business perspective, SQL gives analysts direct access to the source of truth — the database. Instead of waiting for someone else to export data into a spreadsheet, analysts who know SQL can go straight to the data, answer questions faster, and operate with far more independence. That kind of speed and autonomy is incredibly valuable in any analytics role.
SQL also plays a central role in data preparation, which is one of the most time-consuming parts of any analytics project. Before you can build a dashboard, train a machine learning model, or produce a report, the data needs to be cleaned, filtered, and structured. SQL is one of the most efficient tools for doing exactly that.
1. Writing Clean SELECT Statements
Everything in SQL starts with the SELECT statement. It’s how you retrieve data from a database, and while it might seem simple on the surface, writing clean, readable SELECT statements is a skill in itself.
A well-structured SELECT statement specifies exactly what columns you need, applies appropriate filters using WHERE clauses, and avoids pulling unnecessary data. For analysts working with large datasets, this matters a lot — selecting only the columns you actually need reduces query runtime and makes your code far easier to read and maintain.
Good practice here also means using meaningful column aliases, adding comments to clarify complex logic, and structuring your queries in a consistent, organized way. These habits might not seem critical at first, but when you’re collaborating with a team or revisiting your own work weeks later, clean code saves significant time.
2. Mastering JOINs
If writing SELECT statements is the foundation, mastering JOINs is where SQL starts to get genuinely powerful — and where a lot of beginners struggle.
In most real-world databases, data lives across multiple related tables. Customer information might sit in one table, order data in another, and product details in a third. JOINs are how you combine these tables to answer questions that require data from more than one source.
The most common types analysts need to understand are INNER JOIN (returns only rows with matching records in both tables), LEFT JOIN (returns all rows from the left table and matching rows from the right), and LEFT ANTI JOIN (useful for finding records that don’t have a match — great for identifying gaps or unmatched data).
In my Customer Behavior & Retention Analytics project for Olist Brazilian E-Commerce, JOINs were essential for linking customer records, orders, payments, and product data across multiple tables to build a complete view of the customer journey. Without solid JOIN skills, that kind of multi-dimensional analysis simply isn’t possible.
3. Aggregation and GROUP BY
One of the most common tasks in data analytics is summarizing data — calculating totals, averages, counts, and other summary statistics. SQL handles this through aggregation functions like SUM, COUNT, AVG, MIN, and MAX, combined with the GROUP BY clause.
GROUP BY allows you to split data into groups and apply aggregate functions to each group separately. For example, if you want to see total revenue broken down by product category or customer region, GROUP BY is what makes that possible.
This is a core skill for business intelligence work. In my Retail Sales Performance Dashboard, aggregation queries were used constantly to calculate KPIs like total sales by region, average order value by product type, and monthly revenue trends. Those aggregated results feed directly into dashboards that executives and managers use to make decisions.
Understanding how to use HAVING — which filters aggregated results the same way WHERE filters individual rows — is also important here. Together, GROUP BY and HAVING give you precise control over how you summarize and filter your data.
4. Subqueries and Common Table Expressions (CTEs)
As queries get more complex, writing everything in a single SELECT statement becomes messy and hard to read. That’s where subqueries and Common Table Expressions, known as CTEs, come in.
A subquery is essentially a query nested inside another query. It lets you use the results of one query as the input for another. CTEs work similarly but are written as named, temporary result sets at the beginning of your query using the WITH keyword. CTEs are generally preferred over subqueries because they’re much easier to read, debug, and maintain.
From a business perspective, these tools allow analysts to break down complicated multi-step questions into manageable, logical pieces. Instead of one enormous and confusing query, you write a series of clearly labeled steps that build on each other. That’s not just good for readability — it also makes it significantly easier to catch mistakes and explain your logic to non-technical stakeholders.
5. Window Functions
Window functions are one of the most powerful — and most underused — features in SQL. They allow you to perform calculations across a set of rows that are related to the current row, without collapsing the results the way GROUP BY does.
Common window functions include ROW_NUMBER (assigns a unique rank to each row within a partition), RANK and DENSE_RANK (for ranking within groups), LAG and LEAD (for accessing values from previous or next rows, perfect for calculating period-over-period changes), and running totals using SUM with OVER.
For analysts, window functions open up a whole category of analysis that would be extremely difficult to do otherwise. Calculating month-over-month growth, ranking customers by purchase frequency, identifying the first purchase for each customer, or computing a 7-day rolling average — all of these become much more straightforward with window functions.
In the Tokopaedi Business Analysis project, window functions were particularly useful for analyzing sales trends over time and ranking product categories by performance — the kind of temporal and comparative analysis that drives real strategic decisions.
6. Data Filtering and Conditional Logic
Knowing how to precisely filter data is fundamental to any analysis. SQL provides several tools for this: WHERE clauses for row-level filtering, CASE statements for conditional logic, and operators like IN, BETWEEN, LIKE, and IS NULL for more specific conditions.
CASE statements are especially valuable because they let you create new categorizations and labels from your data directly within a query. For example, you might use a CASE statement to group customers into tiers (high-value, medium-value, low-value) based on their purchase history, or to label transactions as completed, pending, or refunded based on a status code.
This kind of conditional logic means analysts can do a significant portion of their data transformation work directly in SQL, before the data even reaches a visualization tool or reporting layer. The result is cleaner, more consistent analysis with fewer steps in the overall workflow.
7. Date and Time Functions
Business data almost always has a time dimension. Sales are tracked by day, week, month, and year. Customer behavior changes over time. Trends only become visible when you can slice and compare data across different time periods. That’s why understanding SQL date and time functions is a non-negotiable skill for analysts.
Different SQL databases handle dates slightly differently, but the core operations are consistent: extracting parts of a date (year, month, day, quarter), calculating the difference between two dates, truncating dates to a specific granularity, and filtering data within a specific date range.
In practice, this might mean calculating how many days have passed since a customer’s last purchase (a key metric for churn analysis), grouping revenue by quarter for a business performance report, or identifying seasonal trends by comparing the same period across multiple years.
In my Customer Behavior & Retention Analytics for Olist Brazilian E-Commerce, date functions were central to analyzing the customer lifecycle — understanding when customers were acquired, how long they remained active, and when they churned. That kind of time-based analysis is what makes customer retention strategies actionable.
8. Data Cleaning in SQL
Raw data is rarely clean. It comes with duplicates, missing values, inconsistent formatting, and outliers that can distort analysis results if left unaddressed. Many people think of data cleaning as something done in Python or Excel, but SQL is actually an excellent tool for a lot of this work — especially when dealing with large datasets already stored in a database.
Common data cleaning tasks in SQL include removing duplicate records using DISTINCT or ROW_NUMBER, handling NULL values with COALESCE or NULLIF, standardizing text formatting with functions like TRIM, UPPER, LOWER, and REPLACE, and casting columns to the correct data types.
Doing data cleaning in SQL has a significant advantage: the transformations happen at the database level, which is typically much faster than loading data into a local environment and cleaning it there. It also means the cleaned data can be made available to the whole team through views or materialized tables, rather than living in a single analyst’s notebook or spreadsheet.
9. Creating Views and Optimizing Query Performance
Views
A view is essentially a saved query that acts like a virtual table. Instead of rewriting the same complex JOIN every time you need a particular dataset, you create a view once and then query it like any other table. Views also serve as a great way to create clean, analysis-ready layers on top of raw data — a practice that aligns closely with how Looker Studio and Power BI connect to data sources in business intelligence workflows.
Query Optimization
On large datasets, poorly written queries can run for minutes or even hours. Understanding basic optimization principles — like avoiding SELECT *, using appropriate indexes, filtering data early in the query rather than at the end, and being mindful of how JOINs are structured — can make a dramatic difference in query performance.
For analysts working in cloud data warehouses like BigQuery or Snowflake, query performance also has a direct cost implication. More efficient queries process less data and cost less to run. That’s a business concern as much as a technical one.
10. Understanding Database Structure and Relationships
The final skill on this list is perhaps the most underrated: understanding how databases are structured and how tables relate to each other. You can know every SQL function and operator by heart and still struggle if you don’t have a clear mental model of the data you’re working with.
This means understanding concepts like primary keys (unique identifiers for each row), foreign keys (columns that reference primary keys in other tables), and the relationships between tables — one-to-one, one-to-many, and many-to-many. It also means being comfortable reading entity-relationship diagrams and understanding data schemas.
When you understand the structure of your database, you write better queries faster. You know which tables to join and how, you know where to look for the data you need, and you can identify when data is missing or structured in an unexpected way. This contextual knowledge is what separates a competent analyst from a genuinely effective one.
Real-World Applications Across Industries
SQL isn’t just an academic skill — it’s used every day across nearly every industry that works with data.
In e-commerce, SQL powers customer segmentation, purchase funnel analysis, churn prediction, and inventory management. In my Customer Behavior & Retention Analytics project, SQL was used to segment customers by purchase behavior and identify at-risk accounts — directly informing retention strategy.
In retail and business intelligence, SQL feeds the dashboards and reports that management teams rely on to track performance. The Retail Sales Performance Dashboard I built relies on SQL queries to aggregate and structure sales data before it reaches the visualization layer.
In digital marketing, SQL connects campaign data with conversion data, enabling analysts to measure ROI, optimize ad spend, and understand which channels drive the most valuable customers. Tools like Google Analytics and Google Ads can be integrated with data warehouses, where SQL becomes the primary analysis layer.
In healthcare, SQL is used to query patient records, track clinical outcomes, and analyze treatment effectiveness — a domain where accuracy is not just a data quality concern but a patient safety issue.
In finance and SaaS, SQL is used for revenue recognition, cohort analysis, subscription metrics like MRR and churn rate, and financial reporting. The underlying SQL skills carry across all of these domains.
Challenges and Limitations of SQL
SQL is powerful, but it’s not without limitations. Understanding these upfront helps analysts know when to reach for a different tool.
First, SQL is designed for structured, tabular data stored in relational databases. It’s not well suited for unstructured data like text documents, images, or JSON-heavy NoSQL databases — though many modern systems are adding JSON support and SQL-like querying capabilities.
Second, complex statistical analysis and machine learning are beyond SQL’s native capabilities. For tasks like building predictive models or running hypothesis tests, you’ll need Python, R, or a specialized platform. SQL often handles the data preparation step before that analysis happens — but it can’t replace dedicated ML frameworks.
Third, performance can be a challenge with very large datasets if queries aren’t optimized or if the database infrastructure isn’t properly scaled. This is where cloud data warehouses like BigQuery shine — they’re built to handle massive scale, but they require analysts to write efficient queries to control cost and runtime.
Finally, SQL syntax varies between database systems. What works in PostgreSQL might not work identically in MySQL or BigQuery. Analysts who work across multiple platforms need to adapt and know where to check documentation when behavior is unexpected.
The Future of SQL in Data Analytics
Despite all the innovation happening in the data space, SQL isn’t going anywhere. If anything, it’s becoming more central as more data gets stored in structured formats and as the tools built around data — including AI assistants — increasingly use SQL as their interface with databases.
Tools like ChatGPT and other AI assistants are beginning to generate SQL from natural language prompts. This is exciting for productivity, but it doesn’t eliminate the need for analysts who deeply understand SQL — if anything, it raises the bar. You need to be able to evaluate, debug, and optimize AI-generated queries, which requires solid foundational knowledge.
There’s also a growing trend toward SQL-first data transformation frameworks, which encourage treating SQL as the primary language for building data pipelines and transformation logic at scale. This is pushing SQL further upstream in the analytics workflow — not just as a query tool, but as a development language for data engineering.
For analysts, staying current with how SQL is evolving across platforms — and how it integrates with BI tools, cloud infrastructure, and AI — is part of staying competitive in the field.
Conclusion
SQL is the foundation of data analytics. It’s one of those skills that, the more you invest in learning it deeply, the more it pays off across every project, every tool, and every role you’ll encounter in a data career.
The 10 skills covered in this article — from clean SELECT statements and JOINs to window functions, data cleaning, and query optimization — represent the core of what makes an analyst genuinely effective with data. They’re not just theoretical checkboxes. They’re practical capabilities that show up constantly in real analytics work, from e-commerce analysis and dashboard development to machine learning pipelines and business reporting.
If you’re just starting out, don’t try to learn everything at once. Focus on the fundamentals first — SELECT, WHERE, JOIN, and GROUP BY — and build from there. Each skill you add opens up a new category of questions you can answer and analyses you can perform.
And if you’re already working in analytics and want to push your SQL further, focus on window functions and query optimization. Those are the areas where skilled analysts most visibly separate themselves from the crowd.
Let’s Connect
I’m a Data Analyst and AI Automation Enthusiast who enjoys turning raw data into clear, actionable insights. If you found this article useful, I’d encourage you to explore my projects portfolio — where you’ll find real-world examples of customer analytics, business intelligence dashboards, machine learning, and more.
If you’re interested in working together or just want to talk data, feel free to reach out through my contact page. I’m open to conversations around Data Analytics, SQL, Dashboard Development, Machine Learning, Business Intelligence, AI Automation, and Digital Marketing Analytics. I’d love to hear what you’re working on.